To open long positions on GBP/USD, you need:
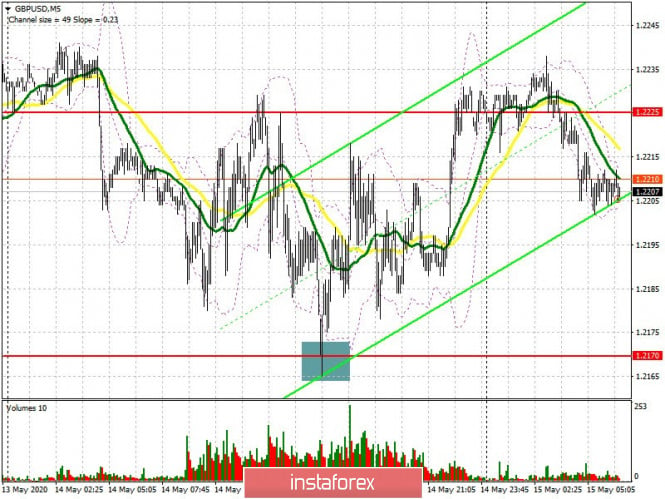
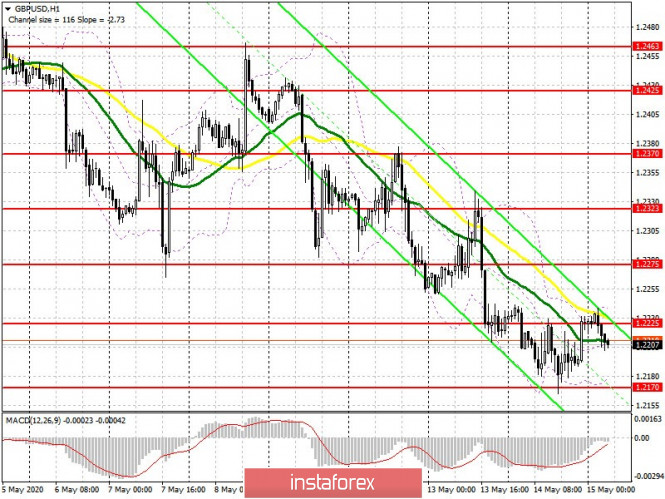
Yesterday, I drew attention to purchases right away on a rebound in the region of a rather interesting level of 1.2170. If you look at the 5-minute chart, you will see how only a single test of this area resulted in a sharp rebound of the pair, and so the pair could not return to the 1.2170 level. This suggests that the bulls are trying to build an upward corrective momentum, but as we can see on the chart, they have problems in the resistance area of 1.2225. This level is their key goal for the first half of the day, since a test of it while consolidating above will be a signal to open long positions in continuing the upward correction and updating the highs of 1.2275 and 1.2323, where I recommend taking profits. If there are no active purchases above 1.2225, it is best to wait for the pound to fall to the low of 1.2170 or to the larger area of 1.2127, and then open long positions from there only when a false breakout is formed. I recommend buying the pound for a rebound only from a major support of 1.2030, the test of which will indicate that a major downward movement for the pair will form.

To open short positions on GBP/USD, you need:
The bears have kept the market under their control, but they might miss at any moment. Therefore, the primary task of sellers of the pound will be to break the range of 1.2170, since this scenario will return major players to the market and they can sharply pull down the pound to the area of lows of 1.2127 and 1.2030, where I recommend taking profits. A more optimal and safe scenario for opening short positions will be forming a false breakout in the resistance area of 1.2225, where the moving averages are also currently held. But you can sell the pound immediately for a rebound after testing the highs of 1.2275 and 1.2323, based on a downward movement of about 30-40 points by the end of the day.

Signals of indicators:
Moving averages
Trading is slightly below 30 and 50 moving averages. This suggests that bears can miss the market at any time.
Note: The period and prices of moving averages are considered by the author on the hourly chart H1 and differs from the general definition of the classic daily moving averages on the daily chart D1.
Bollinger bands
A break of the upper border of the indicator in the region of 1.2230 will lead to a powerful bullish momentum. A break of the lower border at 1.2170 will increase pressure on the pound.
Description of indicators
- Moving average (moving average determines the current trend by smoothing out volatility and noise). Period 50. The graph is marked in yellow.
- Moving average (moving average determines the current trend by smoothing out volatility and noise). Period 30. The graph is marked in green.
- MACD indicator (Moving Average Convergence / Divergence - Moving Average Convergence / Divergence) Fast EMA period 12. Slow EMA period 26. SMA period 9
- Bollinger Bands (Bollinger Bands). Period 20
