To open long positions on GBP/USD, you need:
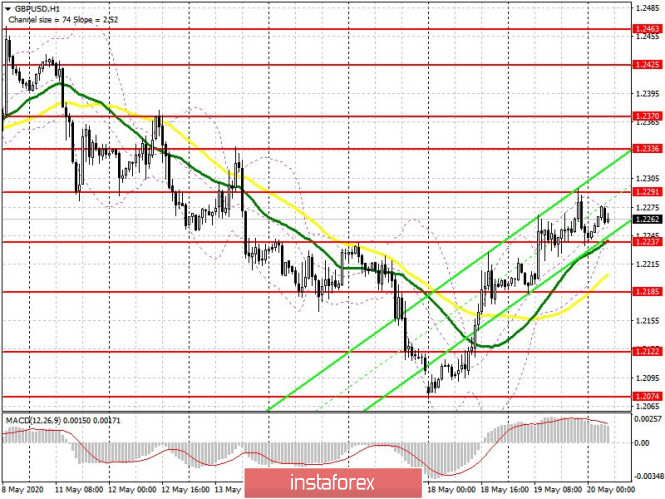
Nothing interesting happened for the pound yesterday afternoon. Buyers tried to go above the day's high in the area of 1.2260, but it did not lead to anything good. Today, the entire focus in the first half of the day will be shifted to inflation in the UK, as well as to the Bank of England's monetary policy report and the speech of Governor Andrew Bailey. Statements about the expansion of the bond repurchase program may indicate pressure on the pound, so it is best to open long positions in the support area of 1.2237 only after forming a false breakout there. Larger buyers will wait for a downward correction of the pound to the support area of 1.2185, as well as a test of the low of 1.2122, from where you can open long positions immediately on the rebound while expecting a correction of 30-40 points within the day. The bulls will also try to build the lower boundary of the new ascending channel from this area. If buyers do not hesitate and achieve a breakthrough of resistance 1.2291, and also gain a foothold on it, an upward correction in GBP/USD will result in an update of the highs of 1.2336 and 1.2370, where I recommend taking profits.
To open short positions on GBP/USD, you need:
Sellers will count on weak inflation and the pound's return to the support level of 1.2237, consolidating below this range will raise pressure on the pair and lead to the demolition of stop orders of bulls with a further return to the low of 1.2185, where I recommend taking profits. The long-term goal of sellers will be to support 1.2122, but the movement in this range will depend directly on the statements made by the Bank of England Governor Andrew Bailey. In the scenario of GBP/USD growth in the first half of the day, and the absence of a false breakout along with active sales at the resistance of 1.2291, it is best to abandon short positions in the pair before the test of larger highs in the area of 1.2336, or sell immediately on the rebound from the resistance of 1.23709, which coincides with the high on May 12.

Signals of indicators:
Moving averages
Trading is above 30 and 50 moving averages, which indicates the continuation of the bull market.
Note: The period and prices of moving averages are considered by the author on the hourly chart H1 and differs from the general definition of the classic daily moving averages on the daily chart D1.
Bollinger bands
A break of the lower border of the indicator in the region of 1.2237 will increase pressure on the pound. A break of the upper border at 1.2275 may trigger new purchases.
Description of indicators
- Moving average (moving average determines the current trend by smoothing out volatility and noise). Period 50. The graph is marked in yellow.
- Moving average (moving average determines the current trend by smoothing out volatility and noise). Period 30. The graph is marked in green.
- MACD indicator (Moving Average Convergence / Divergence - Moving Average Convergence / Divergence) Fast EMA period 12. Slow EMA period 26. SMA period 9
- Bollinger Bands (Bollinger Bands). Period 20
