To open long positions on GBP/USD, you need:
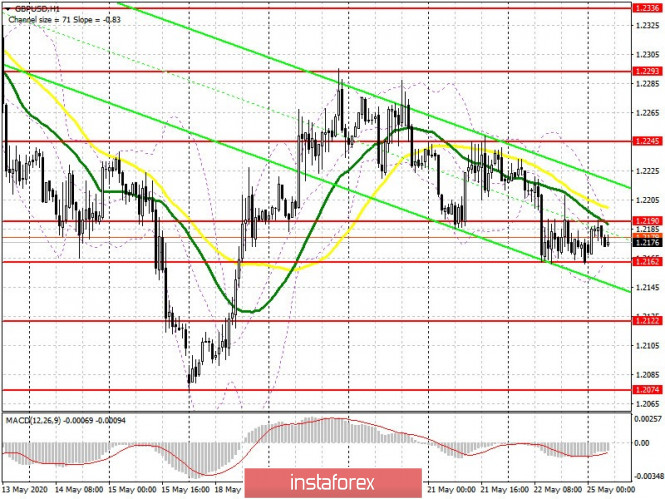
Nothing has changed from a technical point of view. The bulls tried to get above the upper border of the side channel of 1.2190 last Friday afternoon, nothing came of it, which resulted in an even greater decrease in volatility. At the moment, the main task of buyers is to consolidate above the resistance of 1.2190, which may lead to a larger upward correction to the area of a high of 1.2245, and the bulls will aim for 1.2293, where I recommend taking profit. Given that no important fundamental statistics are planned to be released today, a repeated decrease to a low of 1.2162 will most likely lead to its breakout and the pound's further decline in order to form a new trend. Therefore, it is best to look at long positions after updating a larger level of 1.2122, counting on a correction of 30-35 points within the day, or you could buy GBP/USD immediately for a rebound from the low of 1.2074.
To open short positions on GBP/USD you need:
Sellers need to keep the pair below resistance 1.2190 in the first half of the day, with which they successfully coped last Friday. The bearish momentum will continue as long as trading is carried out under this range, and another false breakout will convince sellers of the big buyers' lack of desire to return to the market. A repeated test of the low of 1.2162 will probably result in a sell-off of GBP/USD to the support area of 1.2122, and then to the test of the May low of 1.2074, where I recommend taking profits. In the scenario of a larger upward correction above the 1.2190 level, then it is best to return to short positions on the pound only to rebound from the high in the area of 1.2245, or even higher, in the area of a large resistance of 1.2293 while expecting a downward correction of 30-40 points within the day.

Signals of indicators:
Moving averages
Trade is conducted in the region of 30 and 50 moving average, which indicates the lateral nature of the market.
Note: The period and prices of moving averages are considered by the author on the hourly chart H1 and differs from the general definition of the classic daily moving averages on the daily chart D1.
Bollinger bands
A break of the upper border of the indicator at 1.2190 will lead to a larger growth of the pound. A break of the lower border of the indicator in the region of 1.2162 will increase the pressure on the pair.
Description of indicators
- Moving average (moving average determines the current trend by smoothing out volatility and noise). Period 50. The graph is marked in yellow.
- Moving average (moving average determines the current trend by smoothing out volatility and noise). Period 30. The graph is marked in green.
- MACD indicator (Moving Average Convergence / Divergence - Moving Average Convergence / Divergence) Fast EMA period 12. Slow EMA period 26. SMA period 9
- Bollinger Bands (Bollinger Bands). Period 20
