To open long positions on GBP/USD, you need:
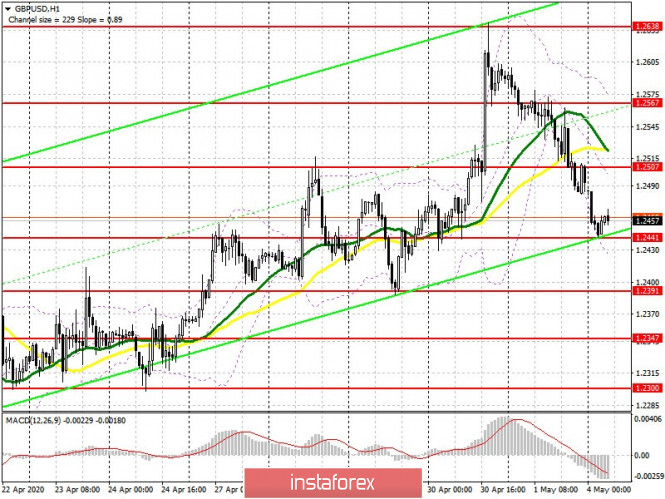
Pressure on the British pound continued to increase on Friday, which I paid attention to in my forecasts. At the moment, the bulls need to protect the support of 1.2441, forming a false breakout at this level will be the first signal to open long positions while expecting an upward correction to the resistance area of 1.2507, where I recommend taking profits, since the moving averages pass above this range. In addition, the lower border of the ascending channel from April 21 passes in the support area of 1.2441, the break of which will indicate a trend reversal. If there is no activity in this range, it is best to postpone purchases until the test of the larger lows of 1.2391 and 1.2347, where you can open long positions immediately for a rebound while expecting a correction of 30-40 points within the day. If the bulls manage to cling to the resistance of 1.2507, the growth will be limited by another major high of 1.2567.
To open short positions on GBP/USD, you need:
Sellers of the pound will act cautious, and most likely there will be very few people willing to sell further on the breakout of the 1.2441 support in the first half of the day. Consolidating below this level with a test from bottom to the top on the volume will be a signal to open short positions based on a breakthrough of the lower border of the ascending channel and a more powerful bearish momentum to the lows of 1.2391 and 1.2347, where I recommend taking profits. More interesting sales will be seen only if there is an upward correction to the resistance area of 1.2507, where forming a false breakout along with the test of moving averages will be a signal to open short positions. I recommend selling GBP/USD immediately on a rebound only from the high of 1.2567.

Signals of indicators:
Moving averages
Trading is below 30 and 50 moving averages, which indicates forming a bearish momentum.
Note: The period and prices of moving averages are considered by the author on the hourly chart H1 and differs from the general definition of the classic daily moving averages on the daily chart D1.
Bollinger bands
If the pound rises in the first half of the day, the average indicator border at 1.2500 will act as resistance, and you can sell the pound immediately for a rebound from a high of 1.2567. A break of the lower border of the indicator in the region of 1.2420 will increase the pressure on the pair.
Description of indicators
- Moving average (moving average determines the current trend by smoothing out volatility and noise). Period 50. The graph is marked in yellow.
- Moving average (moving average determines the current trend by smoothing out volatility and noise). Period 30. The graph is marked in green.
- MACD indicator (Moving Average Convergence / Divergence - moving average convergence / divergence) Fast EMA period 12. Slow EMA period 26. SMA period 9
- Bollinger Bands (Bollinger Bands). Period 20
