Crypto Industry News:
From April 11 to May 14, Bitcoin transaction fees increased by more than 1,250% from $ 0.38 to $ 5.16.
Although transaction fees have since fallen by 33.3% to around $ 3.44, they have risen again by 36.5% since the May 11 halving.
The average cost of transactions in the Bitcoin network increased by over 800% in just one month, with the highest transaction fees from July 2019 recorded in May.
Halving fees increased by more than a third, which resulted in a 105% increase in transaction costs in three days. Although fees reach their highest levels in almost a year, current transaction costs account for less than one-tenth of the record levels recorded at the end of 2017.
Before Bitcoin's second halving on July 9, 2016, fees increased by approximately 200% from $ 0.081 on May 1, 2016, to a peak of about $ 0.24 published both in mid-June and late July of that year.
Bitcoin's first halving on November 28, 2012 increased fees by 300% from November 26 to November 27, followed by a return to pre-halving levels within two days of reducing block prizes.
Technical Market Outlook:
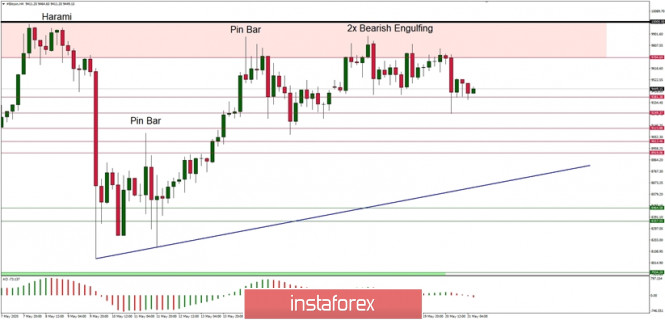
The BTC/USD pair has been seen hovering around the level of $10,000 which is the key short-term technical resistance for the bulls for almost all week, but after the recent local high was made at the level of $9,884, the bears started to make more pressure on the market. In the result, two Bearish Engulfing candlestick patterns were made side by side and the price reacted accordingly. The nearest technical support is seen at the level of $9,382 and $9,249. Please notice, the market conditions on daily time frame chart are extremely overbought.
Weekly Pivot Points:
WR3 - $12,194
WR2 - $10,994
WR1 - $10,553
Weekly Pivot - $9,337
WS1 - $8,765
WS2 - $7,555
WS3 - 7,013
Trading Recommendations:
The larger time frame trend remains down and as long as the level of $10,791 is not violated, all rallies will be treated as a counter-trend corrective moves. This is why the short positions are now more preferred until the level of $10,791 is clearly violated.

