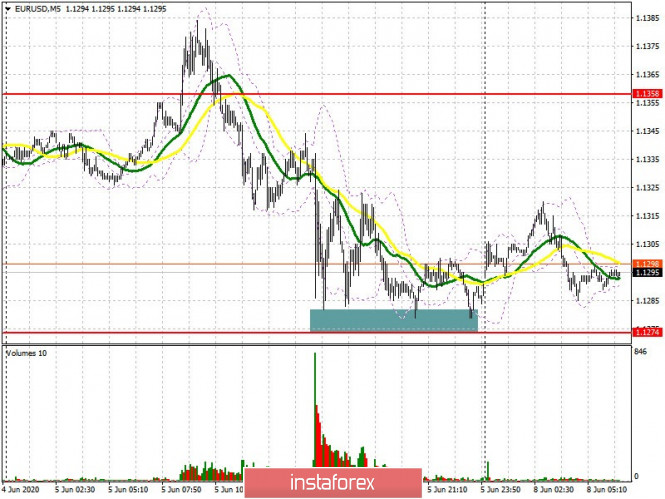
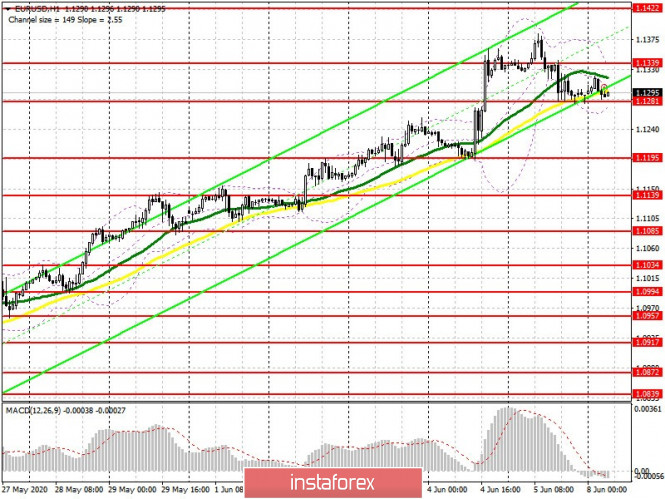
To open long positions on EUR/USD, you need:
On Friday, in my forecast for the afternoon, I drew attention to the probability of a false breakout of the level of 1.1358 and the pair's fall after the release of the report on the state of the US labor market, which happened. The bulls tried to return to the market from this level, where I advised you to open long positions, but nothing good has come of it yet. It should be noted that serious bullish momentum has not yet formed in this range. Forming a false breakout in the morning, which can only happen after good data on German industrial production, will unlikely be a signal to open long positions. However, a breakout and consolidation above the resistance of 1.1339 will be an equally important task for the bulls, which will lead to a larger bullish growth in the area of highs 1.1422 and 1.1459, where I recommend taking profits. In case pressure continues to weigh on the euro, and the German industry in April is unlikely to be able to show anything good, I recommend returning to long positions in EUR/USD only after updating a large support level of 1.1195, counting on a correction of 30-40 points within the day.

To open short positions on EUR/USD, you need:
Bears will try to maintain pressure on the euro, and for this, it is enough to break below the support level of 1.1281, the second test of which will probably happen today after the release of the German industrial production report for April, when the economy was in quarantine. Breakout of 1.1281 will push EUR/USD to the low of 1.1195, and further target will be support 1.1139, where I recommend taking profit. In addition, the bears need not to let the pair go above resistance 1.1339, where forming a false breakout will be an additional signal to open short positions. It is best to sell EUR/USD immediately on the rebound from the new weekly resistance in the area of 1.1422, counting on a correction of 25-30 points within the day.

Signals of indicators:
Moving averages
Trading is carried out in the region of 30 and 50 moving average, which indicates a possible continuation of the downward correction in the pair.
Note: The period and prices of moving averages are considered by the author on the hourly chart H1 and differs from the general definition of the classic daily moving averages on the daily chart D1.
Bollinger bands
A break of the lower border of the indicator in the region of 1.1280 will increase pressure on the euro. A break of the upper border in the area of 1.1335 will lead to an attempt by the bulls to return to the market.
Description of indicators
- Moving average (moving average determines the current trend by smoothing out volatility and noise). Period 50. The graph is marked in yellow.
- Moving average (moving average determines the current trend by smoothing out volatility and noise). Period 30. The graph is marked in green.
- MACD indicator (Moving Average Convergence / Divergence - moving average convergence / divergence) Fast EMA period 12. Slow EMA period 26. SMA period 9
- Bollinger Bands (Bollinger Bands). Period 20
- Non-profit traders are speculators, such as individual traders, hedge funds and large institutions that use the futures market for speculative purposes and meet certain requirements.
- Long nonprofit positions represent the total long open position of nonprofit traders.
- Short nonprofit positions represent the total short open position of nonprofit traders.
- The total non-profit net position is the difference between short and long positions of non-profit traders.
