GBP/USD
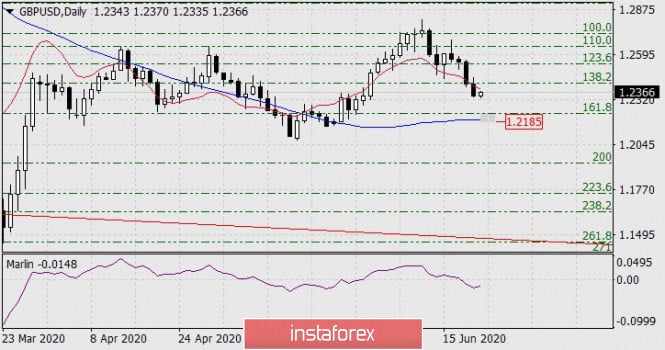
The British pound overcame support for the balance indicator line (red) on the daily chart last Friday. This is a sign of the British currency's mood to work out the nearest technical goal, now it is the range between the MACD indicator line and the Fibonacci level of 161.8% - 1.2185-1.2235.

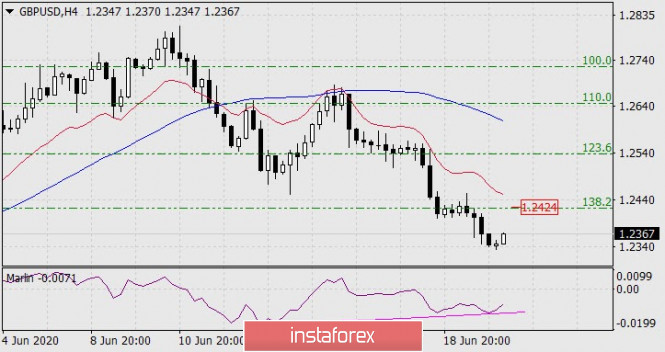
However, the convergence on the Marlin oscillator has almost formed on the four-hour chart, so before the decline continues, a correction to the Fibonacci level of 138.2% at the price of 1.2424 is likely.

