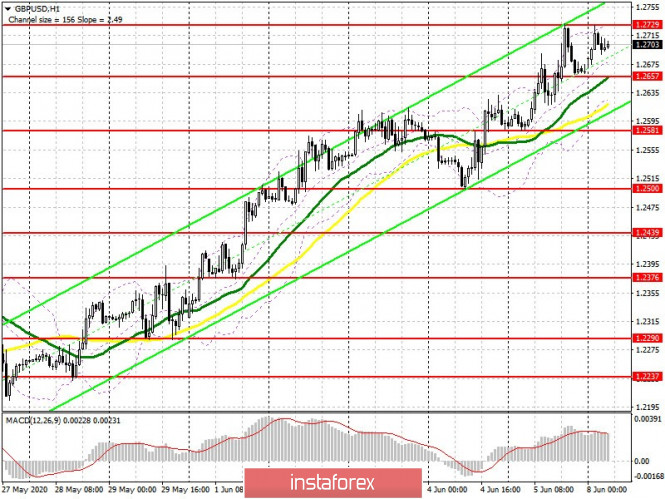
To open long positions on GBP/USD, you need:
The pound's next growth against the US dollar is more likely connected with the greenback's weakness than with the sterling's strength itself, however, we must pay tribute, the pound really enjoys support even without any reason. There is no progress in trade negotiations between the UK and the EU yet, namely they will set the pair's direction in the second half of the year. There are no good economic reports. Buyers of the pound are looking at the resistance of 1.2729, consolidating on it will be a clear signal for continuing the bullish trend with renewing highs in the areas of 1.2798 and 1.2840, where I recommend taking profits. In case GBP/USD falls this morning, buyers will count on the support of 1.2657 and forming a false breakout there with a rebound from the moving averages. If there are no active purchases in this range, it is best to postpone long positions until the test of lows of 1.2581 and 1.2500, based on an upward correction of 30-40 points within the day.
To open short positions on GBP/USD, you need:
So far, sellers are still trying to act when approaching large levels of resistance, but they are not doing so well against the trend. The next task of the bears in the first half of the day is to keep the bulls above resistance 1.2729, where forming a false breakout will be a clear signal to open short positions, which will lead to returning GBP/USD to a rather interesting support level of 1.2657, where the moving averages also go. Consolidating below this range will increase the pressure on the pair and lead to dismantling stop orders of the bulls and a larger pound movement down to form a correction with the goal of a support test of 1.2581 and 1.2500, where I recommend taking profit. When breaking through resistance 1.2729, it is best to abandon short positions to test the high at 1.2798, or sell GBP/USD immediately for a rebound from a larger resistance 1.2840 based on a downward movement of 30-40 points by the end of the day.

Signals of indicators:
Moving averages
Trading is conducted above 30 and 50 moving average, which indicates the continuation of the uptrend.
Note: The period and prices of moving averages are considered by the author on the hourly chart H1 and differs from the general definition of the classic daily moving averages on the daily chart D1.
Bollinger bands
A break of the upper border of the indicator at 1.2730 will lead to a new wave of pound growth. In case of a decrease in the pair, support will be provided by the lower border in the area of 1.2625.
Description of indicators
- Moving average (moving average determines the current trend by smoothing out volatility and noise). Period 50. The graph is marked in yellow.
- Moving average (moving average determines the current trend by smoothing out volatility and noise). Period 30. The graph is marked in green.
- MACD indicator (Moving Average Convergence / Divergence - moving average convergence / divergence) Fast EMA period 12. Slow EMA period 26. SMA period 9
- Bollinger Bands (Bollinger Bands). Period 20
- Non-profit traders are speculators, such as individual traders, hedge funds and large institutions that use the futures market for speculative purposes and meet certain requirements.
- Long nonprofit positions represent the total long open position of nonprofit traders.
- Short nonprofit positions represent the total short open position of nonprofit traders.
- The total non-profit net position is the difference between short and long positions of non-profit traders.
