Crypto Industry News:
Bitcoin mining difficulty is an indicator of the ease with which miners can create new transaction blocks on the network. It increased by almost 15% yesterday. This jump represents the largest upward movement of this type since January 2018. The change occurred at block height of 635.040, and the network adjusted its difficulty to 14.94%, according to data from BTC.com.
This is the highest positive correction of difficulty since January 2018, when the mining sector staggered after the speculative bull run that took place at the end of 2017. Two jumps took place at that time: by 15.36% and 16.84%. They took place on January 13 and 25, respectively.
The difficulty of mining bitcoin shows how difficult the task for miners is to "dig" a new BTC. The indicator "tunes" every 2016 blocks to reflect the state of the network.
After the last halving, the mining award for block mining in the network dropped from 12.5 BTC to 6.25 BTC. In the same period, Bitcoin's hash rate, which measures compulsive network power, lost 26 percent.
Some cryptocurrency mining market participants had to turn off excavators after halving reduced their potential revenues by half.
As a result of these events, after which the mining sector experienced a kind of exodus, there were two negative adjustments of difficulty: May 20 (-6 percent) and June 4 (-9.29 percent).
Technical Market Outlook:
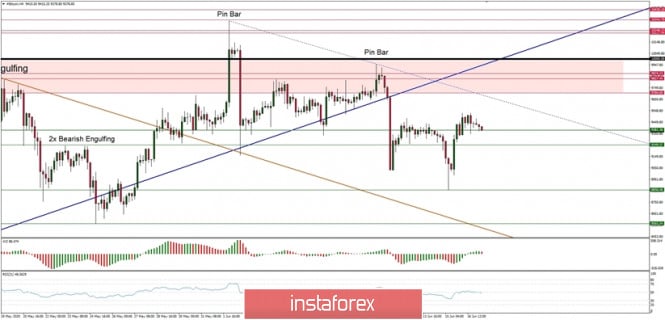
The BTC/USD pair made the local low at the level of $8,860, but there is still a room for another wave down. Nevertheless, the bulls have managed to push the price back up after the low was made and currently the price is trading around the level of $9,400. The local high during the bounce was made at the level of $9,530. In a case of a reversal from here, the next technical support is seen at the level of $8,565 and the nearest technical resistance is still seen at the level of $9,249. The larger time frame trend remains up.
Weekly Pivot Points:
WR3 - $10,691
WR2 - $10,307
WR1 - $9,752
Weekly Pivot - $9,407
WS1 - $8,828
WS2 - $8,448
WS3 - $7,903
Trading Recommendations:
The larger time frame trend remains down and as long as the level of $10,791 is not violated, all rallies will be treated as a counter-trend corrective moves. This is why the short positions are now more preferred until the level of $10,791 is clearly violated. The key mid-term technical support is located at the level of $7,897.

