Good day, dear traders!
Yesterday, the final GDP data for the first quarter came from the UK, which was weaker than expected and disappointed market participants. Let me remind you that the British GDP fell by 2.2%, although forecasts suggested a fall of only 2%.
But the promises of the British Prime Minister Boris Johnson to rescue the country's economy from the crisis in which it fell due to COVID-19, were received by investors with optimism. The British Prime Minister paid special attention to the construction sector, calling for the cost of as many schools, colleges, and hospitals as possible. Let me remind you that earlier we announced the launch of a large-scale infrastructure program for economic recovery after the coronavirus and to facilitate the development of the private property.
From today's events that can affect the price dynamics of GBP/USD, it is worth highlighting the UK manufacturing activity index PMI, which will be published at 09:30 (London time), as well as the Fed minutes, which will be released at 19:00 (London time).
Monthly

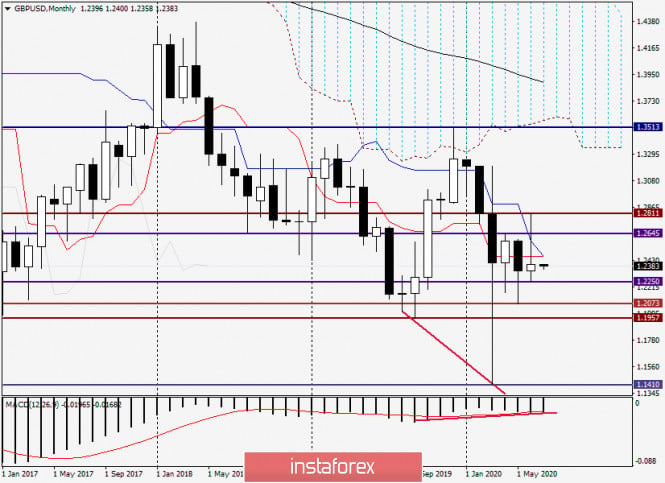
Given that June was closed yesterday, it is impossible to ignore the monthly chart of the pound/dollar currency pair. Here, the first thing that catches the eye is the huge upper shadow of the June candle. As you can see, after reaching highs at 1.2811, the pair lost almost all of its growth and ended last month's trading at 1.2397. Bulls on the pound did not even manage to close June above the important technical level of 1.2400, which previously served as a support function.
It is also worth paying attention to the fact that the trading of the first summer month ended under the Kijun and Tenkan lines of the Ichimoku indicator, which played a significant role in the formation of such a candle. As a rule, after such models of candle analysis, it is difficult to count on the predominance of bullish sentiment. No, of course, there will be rises during this month, but only the confident closing of the current month above 1.2811 will finally confirm the bullish mood for the pound. This is not an easy task. A breakdown of support at 1.2250 looks most likely. If this happens, the pair risks falling to 1.2070.
Daily

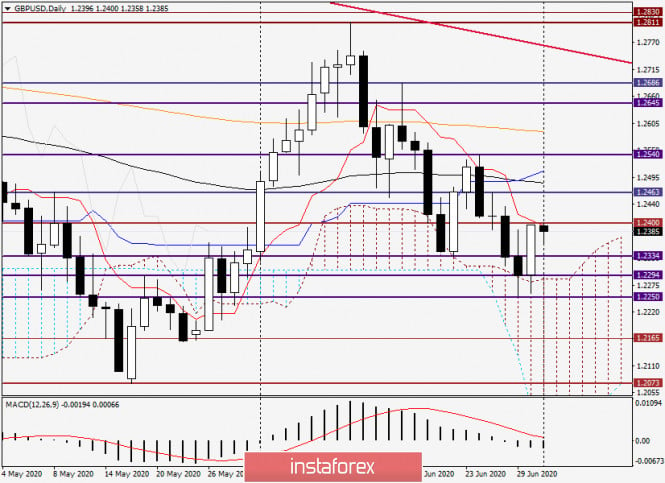
But on the daily chart, at this stage of time, it is not necessary to exclude the ascending scenario at all. The bears' attempts to drive the price within the cloud of the Ichimoku indicator failed again, and pushing off from the upper border of the cloud, the pair rose and closed Monday's trading above the previous highs of 1.2388. In this regard, I do not rule out that the quote will continue to grow today. However, at the moment of completion of the article, the Tenkan line provides strong resistance to attempts to continue moving in the north direction. The pair is trading lower, near 1.2374.
H1

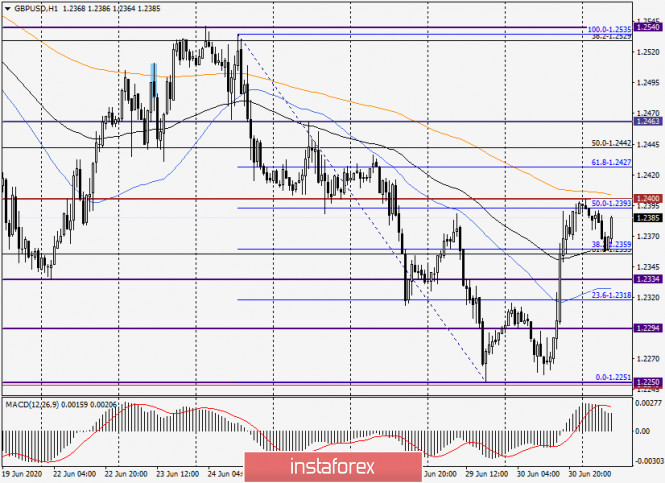
On the hourly chart, we see a rather curious picture. After the fall of 1.2535-1.2251, the quote was corrected to the middle of the indicated fall and then rolled back down. From further decline, the GBP/USD was held by 89 exponential (black) and have found support here, the exchange rate began to strengthen again.
For trading ideas, you should pay attention to the possibility of positioning in both directions. Although, given yesterday's bullish candle and its closing price, I will give the greatest preference to purchases. You can try opening long positions on GBP/USD from the current prices (1.2377) or after breaking the important level of 1.2400, fixing above, on a rollback to this mark.
At the same time, I do not rule out successful sales if bearish candlestick signals appear on the four-hour and (or) hourly charts in the price zone of 1.2388-1.2400. In conclusion, I would like to remind you once again about the publication of the FOMC minutes at 19:00 (London time). The publication of this document will likely have a significant impact on the price dynamics of the US dollar in general and this currency pair in particular.
Good luck with trading!
The material has been provided by InstaForex Company - www.instaforex.com