USD/JPY
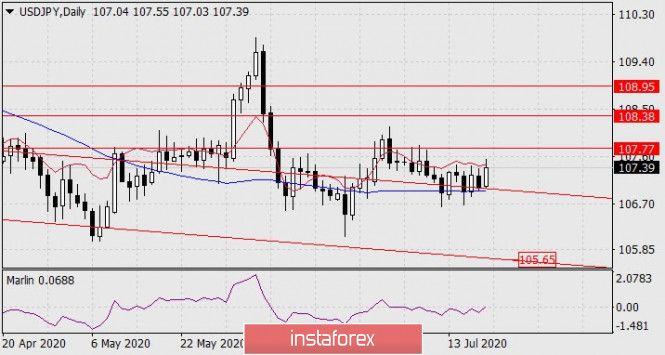
The yen has been in a range between the price channel line and the balance indicator line for the past five days. Uncertainty in the stock market is also transmitted to the "protective" yen. So today, Asian stock indexes are declining against the US market's growth from Friday. The reason for the discrepancy was the data on the Japanese trade balance for June – following its collapse of -838.2 billion yen back in May, the indicator showed -268.8 billion yen in June, while the forecast was at -35.8 billion yen. Moreover, the volume of exports showed -26.2% y/y against the forecast of -24.9%. Imports decreased by 14.4% y/y. The desire for the US stock market's growth has not strengthened at the moment – the S&P 500 rose by 0.28% while the Dow Jones lost -0.23% last Friday. The yen could stay in last week's range for another day.

The growth targets are marked on the daily chart: 107.77, 108.35, 108.95. The goal for a decline is quite deep: 105.65 - support for the embedded line of the price channel.

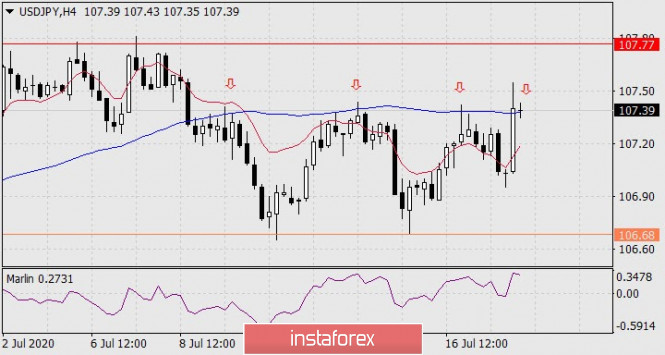
The price turns down from the MACD line for the fourth time. This is another sign that the first bullish target level of 107.77 may not be reached today. But if the price is pinned above 107.40, it will try to do so.
The situation is increasing more in the aggregate of the daily and four-hour charts. But it is advisable to open purchases above 107.77 with a growing US stock market, as well as to sell below 106.70 during a falling US stock market. The yen has clearly not been independent for the past week in the current situation.
The material has been provided by InstaForex Company - www.instaforex.com