To open long positions on GBP/USD, you need:
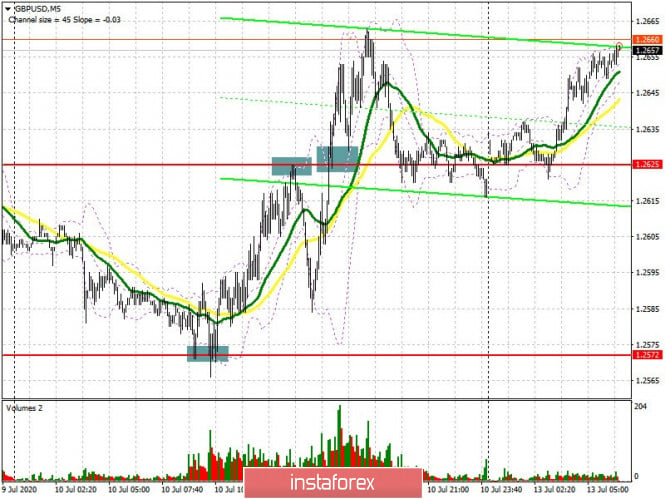
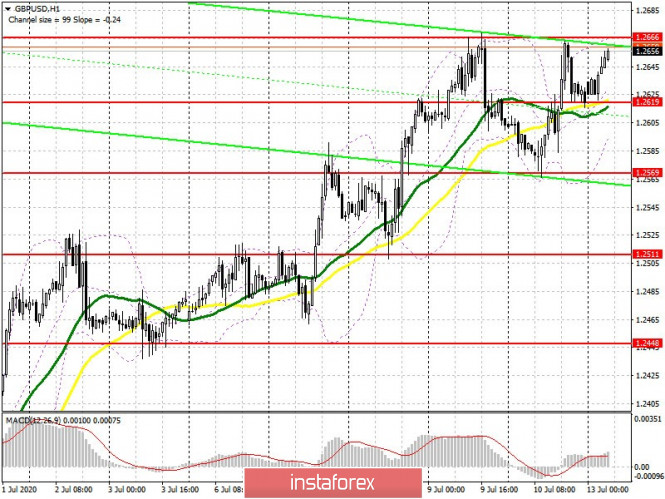
The British pound strengthened its positions last Friday, forming several good signals, both for buying and selling. If you look at the 5-minute chart and recall my review last Friday afternoon, you will see how a false breakout in the support area of 1.2572 became the first signal to buy the pound. Then, there was a good rebound down from the 1.2625 level. But a repeated test of this range led to another buy signal, which continues to work itself out at the current moment. Now a lot depends on how buyers behave at the resistance level of 1.2666, as its breakout will open a direct road to the highs of 1.2742 and 1.2809, where I recommend taking profits. However, you need to consolidate at this level for purchases above 1.2666. If the pressure on the pound returns in the first half of the day, it is best to wait for a false breakout in the support area of 1.2619, or buy GBP/USD immediately for a rebound from the low of 1.2569 based on an expectation of a correction of 30-40 points within the day.

To open short positions on GBP/USD, you need:
Sellers intend to actively protect the 1.2666 resistance, since the pound's direction depends on it. Forming a false breakout in this range will be a signal to sell GBP/USD based on an expectation of a decline and consolidation under the support of 1.2619, which also acts as the middle of the current side channel formed on July 9. A break of 1.2619 will increase the pressure on the pair, which will lead to a test of the lower border of 1.2569, where I recommend taking profits. The low of 1.2511 will be the long-term goal. If the bulls continue to push the market up and achieve a breakout of the 1.2666 resistance, I advise you to postpone short positions until the update of the major resistance of 1.2742, or sell immediately from the high of 1.2809, based on a correction of 30-40 points within the day.

Indicator signals:
Moving averages
Trading is conducted above 30 and 50 moving averages, which indicates the probability of continuing the upward trend.
Note: the period and prices of moving averages are considered by the author on the hourly chart H1 and differ from the general definition of the classic daily moving averages on the daily chart D1.
Bollinger Bands
A break in the lower border of the indicator around 1.2610 will increase the pressure on the pound. Breaking the upper limit of the indicator in the area of 1.2666 will lead to a larger increase in the pound.
Description of indicators
- Moving average (moving average, determines the current trend by smoothing out volatility and noise). Period 50. It is marked in yellow on the chart.
- Moving average (moving average, determines the current trend by smoothing out volatility and noise). Period 30. It is marked in green on the chart.
- MACD indicator (Moving Average Convergence/Divergence — convergence/divergence of moving averages) Fast EMA period 12. Slow EMA period to 26. SMA period 9
- Bollinger Bands (Bollinger Bands). Period 20
- Non-commercial traders are speculators, such as individual traders, hedge funds, and large institutions that use the futures market for speculative purposes and meet certain requirements.
- Long non-commercial positions represent the total long open position of non-commercial traders.
- Short non-commercial positions represent the total short open position of non-commercial traders.
- The total non-commercial net position is the difference between short and long positions of non-commercial traders.
