Technical Market Outlook:
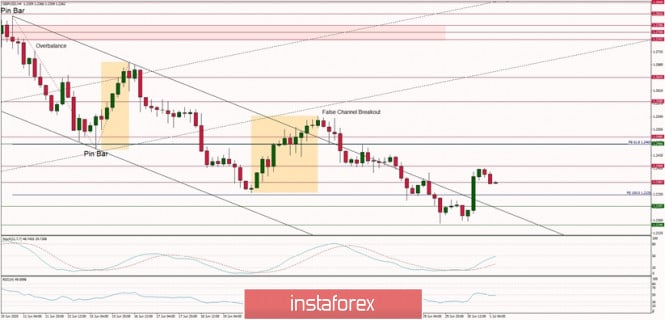
After the GBP/USD pair has made a local low at the level of 1.2251 after all the bounces were too shallow to trigger a strong rally. Nevertheless, the price has temporary broken out the descending channel and tested the technical resistance seen at the level of 1.2362. Despite the bounce from the oversold market conditions, the momentum remains weak and negative as the RSI indicator hovers below its fifty level. The nearest technical resistance is seen at the level of 1.2406. The larger time frame trend remains bullish.
Weekly Pivot Points:
WR3 - 1.2667
WR2 - 1.2600
WR1 - 1.2441
Weekly Pivot - 1.2377
WS1 - 1.2213
WS2 - 1.2143
WS3 - 1.1969
Trading Recommendations:
On the GBP/USD pair the main trend is down, which can be confirmed by the down candles on the weekly time frame chart. The key long-term technical support has been recently violated (1.1983) and the new one is seen at the level of 1.1404. The key long-term technical resistance is seen at the level of 1.3518. Only if one of these levels is clearly violated, the main trend might reverse (1.3518) or accelerate (1.1404). The market might have done a Double Top pattern at the level of 1.2645, so the price might move even lower in the longer-term.

