To open long positions on EURUSD, you need to:
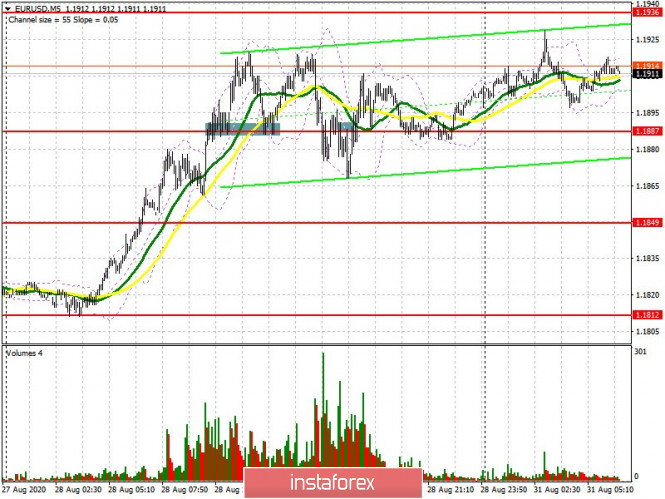
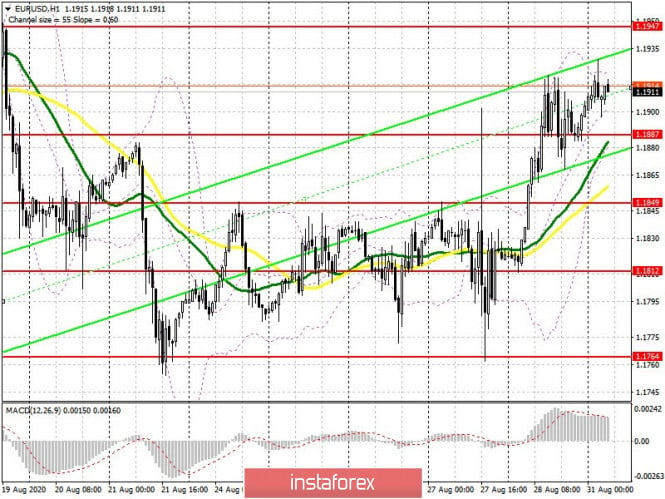
Last Friday, buyers of the European currency ignored the good fundamental data on the US economy and continued to push the pair to new monthly highs, before the update of which is very short. But will the bulls have enough strength for this on the last summer trading day? As for the deals that were on Friday afternoon, let's look at them. On the 5-minute chart, I noted an excellent entry point after a breakout and settling above the resistance of 1.1887. Especially the repeated test after the pair fell to the 1.1887 level, which made it possible to take more than 30 points from the market. By the end of the US session, the bears tried to form an entry point into short positions by pulling the pair back under the 1.1887 area and testing it from the bottom up. However, following a small movement of about 18 points, the bulls regained control of the market. At the moment, euro buyers should form a false breakout at the support level of 1.1887, where the moving averages that play on the side of the bulls are now passing. Only such a scenario will allow us to count on the pair's growth and a breakout of the 1.1947 resistance. Settling on it will open a direct path for the euro to new highs of 1.1994 and 1.2022, where I recommend taking the profit. If buyers of the euro are not active at the 1.1887 level, it is best to postpone long positions until the 1.1849 level has been updated and buy there for a rebound based on a correction of 20-30 points within the day.

To open short positions on EUR/USD, you need to:
Bears can only rely on weak fundamentals for the eurozone countries today. Attention will be drawn to Italy's GDP, as well as inflation in Germany. If the data turns out to be better than economists' forecasts, it will help sellers of the euro in returning the pair to the support of 1.1887. Settling below this level forms a good signal to sell EUR/USD in anticipation of falling to the support of 1.1849 and updating the low of 1.1812, where I recommend taking profits. In case the pair grows, especially if the data indicates an increase in consumer prices, it is best not to rush with sales, but to wait for an update and a false breakout to form near the monthly high of 1.1947. I recommend opening short positions immediately for a rebound only from the 1.1994 level, or even higher – from the large resistance of 1.2022, based on a correction of 20-30 points within the day.

Indicator signals:
Moving averages
Trading is carried out slightly above 30 and 50 moving averages, which indicates the likelihood of continued growth in the euro.
Note: The period and prices of moving averages are considered by the author on the H1 hourly chart and differs from the general definition of the classic daily moving averages on the D1 daily chart.
Bollinger Bands
A breakout of the upper border of the indicator in the 1.1920 area will strengthen the demand for the euro. In case of a decline in the pair, intermediate support will be provided by the lower border of the indicator around 1.1880.
Description of indicators
- Moving average (moving average, determines the current trend by smoothing out volatility and noise). Period 50. It is marked in yellow on the chart.
- Moving average (moving average, determines the current trend by smoothing out volatility and noise). Period 30. It is marked in green on the chart.
- MACD indicator (Moving Average Convergence/Divergence — convergence/divergence of moving averages) Fast EMA period 12. Slow EMA period to 26. SMA period 9
- Bollinger Bands (Bollinger Bands). Period 20
- Non-commercial speculative traders, such as individual traders, hedge funds, and large institutions that use the futures market for speculative purposes and meet certain requirements.
- Long non-commercial positions represent the total long open position of non-commercial traders.
- Short non-commercial positions represent the total short open position of non-commercial traders.
- Total non-commercial net position is the difference between the short and long positions of non-commercial traders.
