GBP/USD
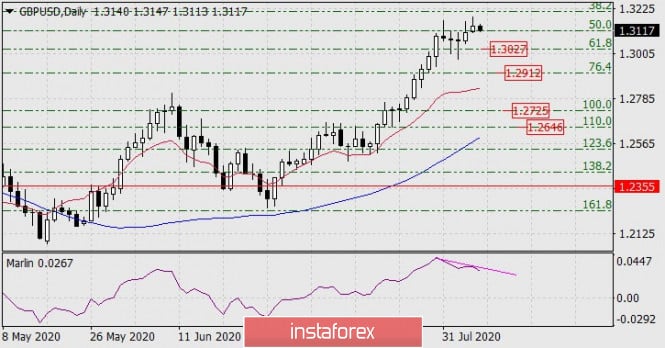
A small divergence has formed on the British pound's daily chart. But this is still a reversal sign. In general, the price was in the January 2020 trading range last week, and is now going to go down from it. The first target is 1.3027, then 1.2912, then 1.2725. Target levels are determined by Fibonacci levels stretched along the baseline of the movement on December 13, 2019 to February 28, 2020. They are still working, but soon the target levels will need to be adjusted.

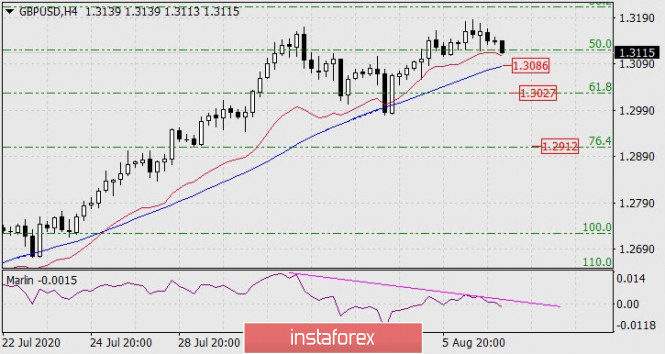
The Marlin divergence looks more significant on the four-hour chart. The signal line of the oscillator has already entered the negative trend zone (decreasing). After overcoming the support of the MACD line (1.3086), the first target of 1.3027 at the Fibonacci level of 61.8% will open. The second target is 1.2912.

