EUR/USD 1H

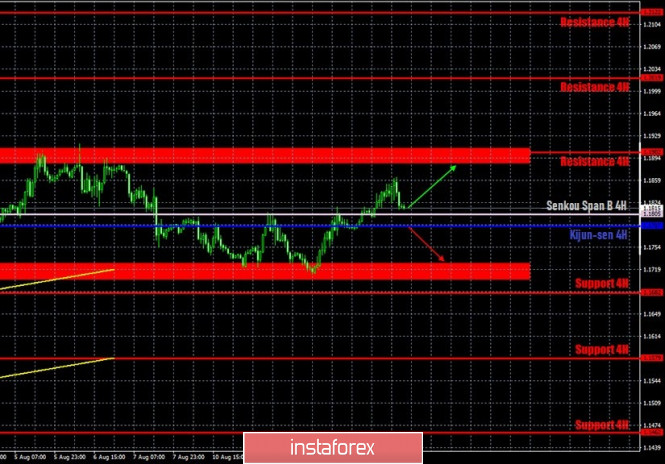
The euro/dollar pair managed to consolidate above the Kijun-sen and Senkou Span B lines on the hourly timeframe of August 13. Therefore, the bulls even got the opportunity to continue buying the euro while aiming for the resistance area of 1.1884-1.1910. However, the quotes did not reach this area during the day. And in general, the pair is still moving sideways, limited by the $1.17 and $1.19 levels. Therefore, you can trade within it until you go beyond this range. At the same time, you should understand that there is no trend at this time. Bulls and bears still can't decide which way to move the pair further.
EUR/USD 15M

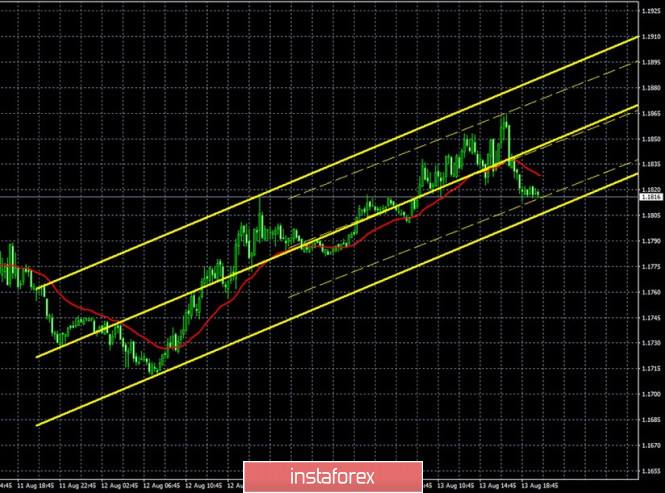
Both linear regression channels turned up on the 15-minute timeframe after traders failed to overcome the 1.1702-1.1727 area. The latest Commitment of Traders (COT) report, released last Friday, showed that the mood of professional traders did not change at all during the last reporting week on July 29-August 4 (the report is published with a three-day delay). During this time period, the "non-commercial" category of traders opened 19,354 Buy-contracts and closed 3,561 Sell-contracts. Thus, the net position for the most important category of traders has grown by 23,000 at once, which is a very large and eloquent indication of the current mood of the major players. The most important thing is that the report exactly matches what is happening in the foreign exchange market, since the euro as a whole continued to grow until August 4. The euro did not suffer any losses during the entire current week. Thus, most likely, the new COT report, which will be published as early as this afternoon, will show that non-commercial traders were increasing purchases again. Or, at least, the net position of non-commercial traders has not decreased. In this case, we will have to state that the market remains very bullish.
The fundamental background for the EUR/USD pair was extremely weak on Thursday. Inflation in Germany released in the morning and applications for unemployment benefits in America in the afternoon. No more macroeconomic data were published that day. Although the report on applications for unemployment benefits should have pleased traders, as for the first time since the beginning of the pandemic, their number was less than 1 million. The number of secondary applications continues to decline and is already 15.5 million. Unfortunately, these are still high unemployment rates, but they are still falling. The US dollar responded to this report with a restrained drop of only 30-40 points. The following data will be released in the last trading day of the week: the EU will publish an important report on GDP for the second quarter, and in the United States – retail sales for July, industrial production for July, as well as the consumer confidence index of the Institute of Michigan for August. We believe that the eurozone GDP report can support the US currency. Especially if it turns out to be worse than forecasted at -12.1% from the previous quarter.
Based on the above, we have two trading ideas for August 14:
1) Buyers continue to wait for the right moment to restart active trading. To make new purchases of the euro, you are advised to wait until the price consolidates above the resistance area of 1.1884-1.1910. Then we recommend buying the pair while aiming for the resistance level of 1.2019. In this case, the potential Take Profit is about 80 points. You can also trade relative to the Kijun-sen line inside the sideways channel, but trading in a flat is not the most pleasant experience.
2) Bears continue to experience big problems and cannot go below 1.1715. We recommend opening sales after breaking through the support area of 1.1702-1.1727 with the first target at the 1.1579 level. Potential Take Profit in this case will be about 90 points. If the price consolidates below the Kijun-sen line, you can open small shorts with the 1.1720 target.
Hot forecast and trading signals for the GBP/USD pair.
We recommend that you also explore the fundamental background in these articles:
Overview of the EUR/USD pair. August 14. US economy has contracted twice as much as the EU economy due to the pandemic. Trump loses his last advantage in front of voters.
Explanations for illustrations:
Support and Resistance Levels are the Levels that serve as targets when buying or selling the pair. You can place Take Profit near these levels.
Kijun-sen and Senkou Span B lines - lines of the Ichimoku indicator transferred to the hourly timeframe from the 4-hour one.
Support and resistance areas are areas from which the price has repeatedly rebounded off.
Yellow lines - trend lines, trend channels and any other technical patterns.
The material has been provided by InstaForex Company - www.instaforex.com