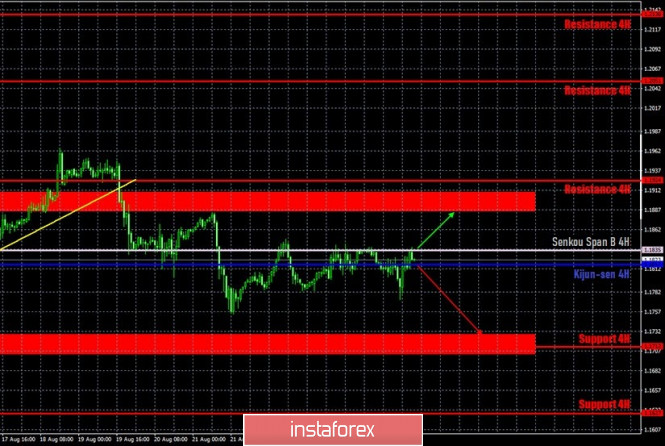
EUR/USD 1H

The euro/dollar pair continued absolutely indistinct trading just below the Senkou Span B line on the hourly timeframe on August 26. The price settled below the Senkou Span B line, which provided good chances for the pair to move to the 1.1712 support level, which is also the lower the border of the sideways channel, in which the pair has been trading for more than a month. However, despite this fact, the bears continued to show weakness and refused to sell the pair. Thus, the euro/dollar pair has spent the last few days in a narrow price range with a width of only 100 points. The price settled above the Senkou Span B and Kijun-sen lines, and even this fact did not make it possible for traders to seriously count on strong growth.
EUR/USD 15M
Both linear regression channels reverse every day on the 15 minute timeframe as the pair is constantly changing direction. In general, it is flat. The latest Commitments of Traders (COT) report was released last Friday. According to this report, non-commercial traders were extremely calm during the reporting week (August 12-18). During this period, the "non-commercial" category of traders, which is considered the most important, closed 4,500 Buy-contracts and 4,500 thousand Sell-contracts. Thus, the net position for this category of professional players has not changed at all. And along with it, the mood of traders has not changed either. Thus, the COT report still does not give any grounds to assume that the upward trend has ended. Even if we take into account the fact that the pair fell by 200 points in the period from August 19 to 21, it still does not change anything. During the current upward trend, which has been forming for three months, the pair has already dropped by 200 points. This value continues to remain small, since the pair's overall growth during this period was about 1200 points. Throughout the current week, the pair has been in an absolutely incomprehensible movement and certainly this cannot mean that the mood of large market participants will change. The last three trading days of this week will not be included in tomorrow's new COT report, but even without them, it is clear that serious changes are not expected from it.
Yesterday's fundamental background for the EUR/USD pair was expressed through a single report from overseas. Durable goods orders in the US turned out to be significantly higher than experts predicted. However, the dollar could not extract any dividends from this report. The complex fundamental background in America continues to drive bears out of the market. We do not expect important publications and events from the European Union today. The market will focus on the Economic Symposium in Jackson Hole, at which the Federal Reserve Chairman Jerome Powell is set to give a speech. US Q2 GDP reports, jobless claims and personal consumption spending indices are unlikely to cause a serious market reaction. Especially after an equally important report was ignored today.
Based on the above, we have two trading ideas for August 27:
1) Bulls as a whole continue to take profits on previously opened deals and do not intend to return to the market with new long deals of the euro in the near future. The pair continues to trade below the Senkou Span B line, but cannot continue to fall. Thus, in order for the upward trend to resume, the quotes must return to the area above the range of 1.1886-1.1910. In this case, we will recommend buying the euro with the target at the resistance level of 1.2051. Take Profit in this case will be up to 110 points.
2) Bears have finally seized the initiative in the market, but they do not have big dividends from this. It all depends on the bulls now, who continue to take profits on long positions. Selling the pair can be seen with the target at the support area of 1.1702-1.1727, if the price manages to stay below the Senkou Span B line (1.1835), but you can see how the quotes are moving down. In this case, the potential Take Profit is 70-80 points.
Explanations for illustrations:
Support and Resistance Levels are the levels that serve as targets when buying or selling the pair. You can place Take Profit near these levels.
Kijun-sen and Senkou Span B lines are lines of the Ichimoku indicator transferred to the hourly timeframe from the 4-hour one.
Support and resistance areas are areas from which the price has repeatedly rebounded off.
Yellow lines are trend lines, trend channels and any other technical patterns.
The material has been provided by InstaForex Company - www.instaforex.com