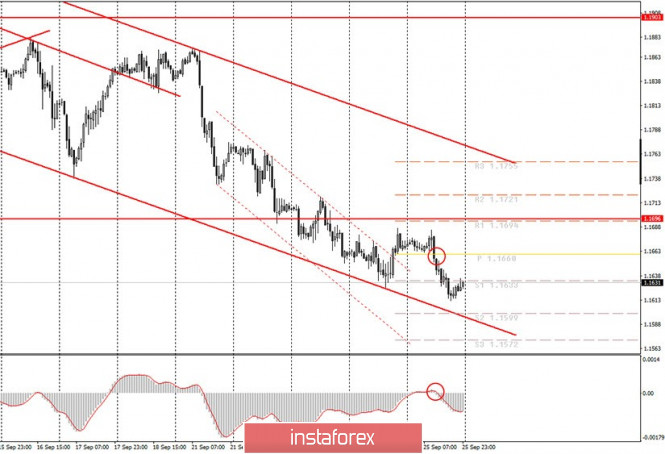
Hourly chart of the EUR/USD pair

The EUR/USD pair was trading in full accordance with our morning assumptions on Friday, September 25. In the morning article, we said that it is not advisable to buy the pair now, since there is a downward trend, and trading against the trend is als not recommended. This also applies to experienced traders, not just beginners. The MACD indicator had previously been discharged to zero, which made it possible to consider it again as a provider of strong sell signals. And so it happened. The MACD indicator reacted to the first downward bar with a downward reversal (the signal is circled), according to which novice traders could open short positions. The targets were the levels 1.1633 and 1.1599. The first one was reached, the second was not. But even if traders did not close sell orders near the first target, the pair returned to this level again afterwards, thus, a profit of about 20-30 points could be obtained. On the whole, the overall technical picture did not change at all on Friday. The pair's quotes remained in the lower area of the descending channel, so an upward correction is still very likely.
A report on durable goods orders for August was released in America on the final trading day of the week. We have already said that this report is quite important, since this category of goods is quite expensive, which means it has a significant impact on GDP and well reflects the purchasing power and desire to make expensive purchases. However, we also mentioned that, according to forecasts, changes are expected to be minimal compared to July. And so it happened in practice. Four derived indicators, two of which turned out to be worse than forecasted, two - better. In general, the highest growth was 1.8%, the lowest at 0.4%. As such, the changes were minimal and we cannot conclude that the markets were diligently working through this report. However, demand for the US dollar recovered on Friday. We believe that for the same technical reasons, due to which it began in principle, there was a need for a deeper correction after rising by 1300 points.
There are no macroeconomic events scheduled for Monday, September 28, in the European Union and the United States. Therefore, the first trading day of a new week might be very boring, as is often the case. An upward correction to the area of the upper line of the descending channel may even begin.
Possible scenarios for September 28:
1) Novice traders are still not recommended to place buy positions at this time, since there is a clear downward trend, and trading against the trend is not recommended in principle. Thus, it will be possible to consider long positions but first the price should settle above the downward trend channel or a new upward trend should appear, supported by a trend line or other channel.
2) Selling remains relevant despite the fact that the pair is trading near the lower border of the descending channel, that is, it retains high chances for starting an upward correction. However, in our experience, we can say that such forward movements along the trend, which have been observed since September 21, can be very long. Thus, on Monday it will be possible to open new short positions with targets at 1.1599 and 1.1572 after the MACD indicator recovers to the zero level and forms a new sell signal.
On the chart:
Support and Resistance Levels are the Levels that serve as targets when buying or selling the pair. You can place Take Profit near these levels.
Red lines are the channels or trend lines that display the current trend and show in which direction it is better to trade now.
Up/down arrows show where you should sell or buy after reaching or breaking through particular levels.
The MACD indicator (10,20,3) consists of a histogram and a signal line. When they cross, this is a signal to enter the market. It is recommended to use this indicator in combination with trend lines (channels and trend lines).
Important announcements and economic reports that you can always find in the news calendar can seriously influence the trajectory of a currency pair. Therefore, at the time of their release, we recommended trading as carefully as possible or exit the market in order to avoid a sharp price reversal.
Beginners on Forex should remember that not every single trade has to be profitable. The development of a clear strategy and money management are the key to success in trading over a long period of time.
The material has been provided by InstaForex Company - www.instaforex.com