USD/JPY
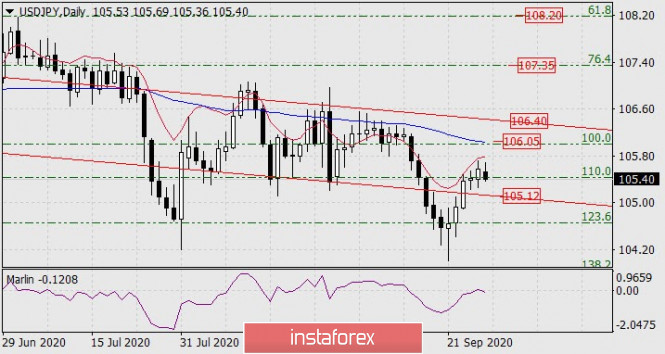
The US stock market grew last Friday after it has fallen by 9.88% since September 2. The S&P 500 gained 1.60% while the USD/JPY pair added 15 points on Friday. This morning the price stayed at the Fibonacci level of 110.0%, and if the signal line of the Marlin oscillator strengthens the reversal mood from the border of the growth territory, then the price may fall to the price channel line in the area of the 105.12 level. If risk appetite turns out to be stronger, the price will continue to grow towards the first target of 106.05 - to the Fibonacci level of 100.0%, which is near the MACD line. A signal for long term growth is when the price goes beyond the area above today's high of 105.69.

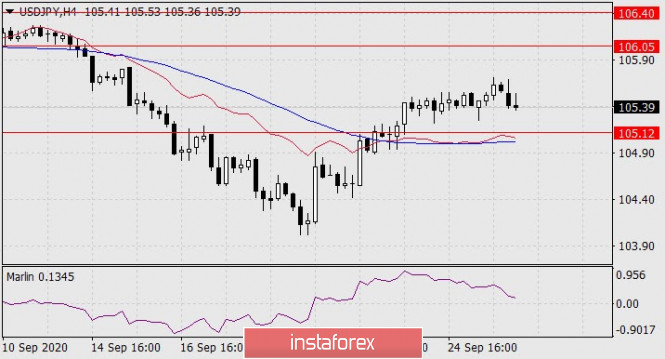
The price is growing above the balance and MACD indicator lines on the four-hour chart, and the MACD line itself turns to the upside. This is a sign that growth is becoming stronger in the medium-term. The Marlin oscillator has eased, dropped to the border of the bears' territory, and is now ready to continue growing, unless we receive strong negative news.

