EUR/USD 1H

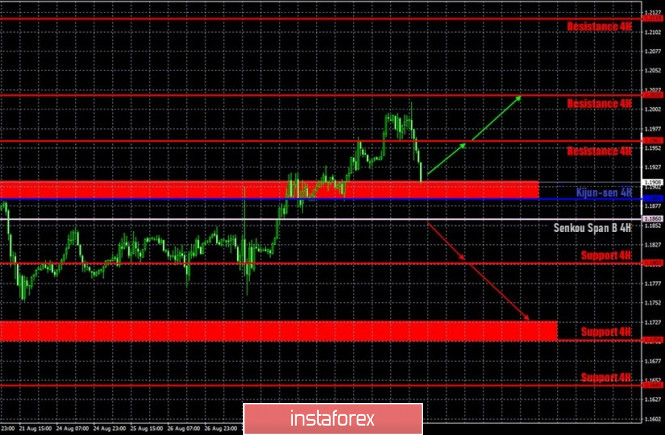
The euro/dollar pair hit the psychological level of $1.20 on the hourly timeframe on September 1 and, rebounding off it, began to correct. However, given the general mood of market participants, the downward correction may not be too strong again. For example, there may be a rebound from the support area of 1.1885-1.1909, after which the upward movement will resume again. Thus, we recommend opening new long positions after rebounding from important supports or after overcoming important resistances. Unfortunately, there is still no upward trend line available to traders. More precisely, it can be built, but its angle would be too sharp of an inclination and will be broken literally by the first more or less significant correction. Thus, we believe that such a trend line does not make any sense.
EUR/USD 15M

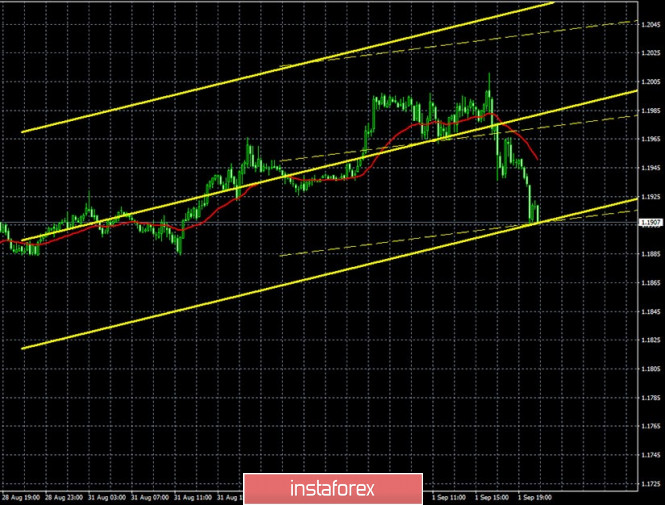
Both channels of linear regression are still directed upwards on the 15-minute timeframe, signaling that there is no correction even in the most short-term plan. A new Commitments of traders (COT) report was released last Friday. Take note that its character has not changed at all compared to previous COT reports. Despite the fact that the euro/dollar has been trading within the side channel for more than a month, professional traders continue to increase their net position. In other words, the number of Buy-contracts for non-commercial traders (the most important group of traders) has been growing, while the number of Sell-contracts is decreasing. The non-commercial category of traders opened 1,302 Buy-contracts and closed 11,310 Sell-contracts during the reporting week of August 19-25. Thus, the net position (the difference between the number of Buy and Sell contracts) increased by 12,000. Therefore, we can draw the same conclusions as we did both a week ago and two weeks ago: professional traders continue to view the euro as a more attractive currency to invest in than the US dollar. The situation did not change during the last three trading days of last week, which were not included in the latest COT report, since the euro was still getting more expensive. The euro continues to grow at the beginning of the new trading week. Yesterday was the final day to be included in the new COT report, which will be released this Friday.
Several rather important and interesting reports were published in the eurozone on September 1, Tuesday. However, as we assumed a day earlier, traders did not particularly react to any of them. Business activity indices in the manufacturing sectors of Germany and the EU remained practically unchanged in August compared to the previous month. The same can be said for the unemployment rate in Germany. In the European Union, unemployment rose to only 7.9% in July (forecast 8%), while European inflation slowed down to -0.2% y/y. In fact, deflation began in the eurozone - a fall in prices. The core consumer price index fell to 0.4% y/y. In general, you can consider the EU data as weak, but traders did not react to it in any way. A restrained reaction was only followed by the US ISM Manufacturing PMI, which rose from 54.2 to 56.0. The US dollar has risen in price by literally 60-70 points after this data was released. Today we recommend traders to pay attention to the ADP report on the level of employment in the US private sector for August. The strong value of the report may trigger new growth in the US currency.
Based on the above, we have two trading ideas for September 2:
1) The bulls, having reached the 1.2000 level, began to take profits on long positions, which led to a correction. Nevertheless, buy orders remain relevant at this time (as long as the price is above the Kijun-sen line). Thus, we recommend looking for new buy signals. One of the possible options could be a rebound from the support area of 1.1885-1.1909 or the Kijun-sen line (1.1886), which will allow opening new longs with targets at 1.1961 and 1.2020. Take Profit in this case will be from 30 to 90 points.
2) Bears will have a new opportunity to start a new downward trend if they manage to gain a foothold below the Senkou Span B line (1.1860). In this case, we recommend opening short positions with targets at 1.1803 and the support area at 1.1705-1.1728. In this case, the potential Take Profit is from 40 to 110 points.
Explanations for illustrations:
Support and Resistance Levels are the levels that serve as targets when buying or selling the pair. You can place Take Profit near these levels.
Kijun-sen and Senkou Span B lines are lines of the Ichimoku indicator transferred to the hourly timeframe from the 4-hour one.
Support and resistance areas are areas from which the price has repeatedly rebounded off.
Yellow lines are trend lines, trend channels and any other technical patterns.
The material has been provided by InstaForex Company - www.instaforex.com