GBP/USD 1H

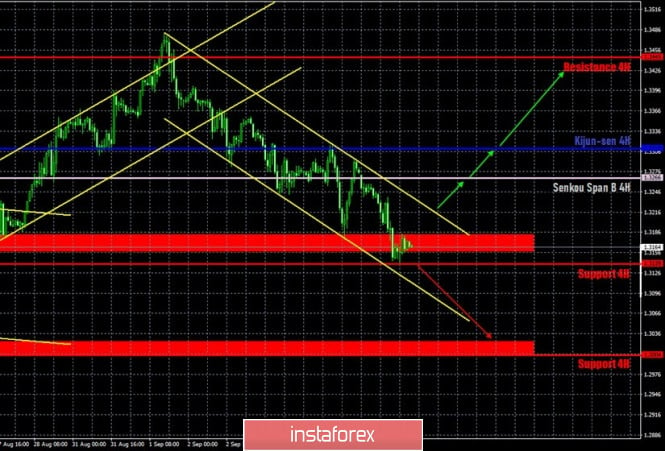
The GBP/USD currency pair, in contrast to EUR/USD, started to move down again on September 7, and so it reached the first support level of 1.3139 and the support area of 1.3156-1.3184. Thus, despite the day's empty calendar of macroeconomic events, market participants found a reason for selling the British currency on Monday. Now sellers need to make a successful attempt to overcome the 1.3139 level, and it may continue to move down with renewed vigor. In addition to the fact that the downward movement is now visible with the naked eye, we have also formed a new downward channel, which supports the bearish traders. Setting the price above this channel will make it possible to conclude that the US dollar has temporarily stopped growing. However, you should only consider trading bearish while the pair's quotes are still within this channel
GBP/USD 15M

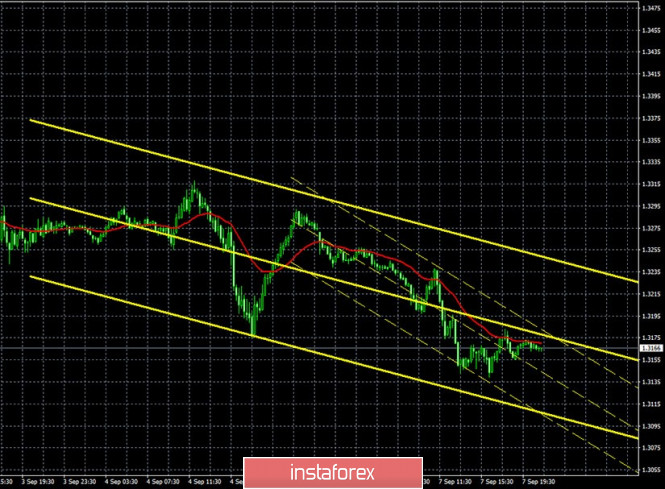
Both linear regression channels continue to be directed downward on the 15 minute timeframe, thus, we can conclude that the downtrend is weak, but it still persists. The latest Commitments of Traders (COT) report for the British pound turned out to be even more unexpected than the one for the euro. If non-commercial traders were already shorting the euro, the same category of traders continued to buy the pound sterling. In total, professional traders opened 5,500 new Buy-contracts and 3,000 new Sell-contracts during the reporting week (August 26-September 1), and so their net position even increased by 2,500, according to a new COT report. In principle, the data perfectly describes what is happening in the foreign exchange market, since the British currency continued to grow during all five trading days included in the report. The pound has been depreciating from September 1 to the present day, but there is no hint that professional traders have stopped looking towards the pound (unlike the euro) in the latest COT report. Therefore, we can not find a correlation between the two main competitors of the US dollar at this time, based on the COT reports, although both major currency pairs have been moving almost identical lately.
The fundamental background on Monday, September 7, mainly came down to Brexit-related topics. First, traders received information regarding a new deadline for talks "by Boris Johnson", and then - unconfirmed information that London may refuse to fulfill some agreements with the European Union regarding Brexit, concluded last year. In addition, a new round of talks between the groups of Michel Barnier and David Frost starts on Tuesday, September 8, which means that we will be able to receive new information about the lack of progress, moving backward, not forward and other optimistic theses by today or tomorrow. We have finally received very interesting news from the UK, but, unfortunately, not everything was positive for the pound. In recent weeks, we have regularly reminded traders that there is no particular reason to strengthen the pound at this time, as there are still a huge number of geopolitical and economic problems in the UK. It seems that market participants have finally remembered them, which immediately translates into the pound's fall. We can expect the pound to fall If we do not receive disappointing news from overseas in the near future.
We have two trading ideas for September 8:
1) Buyers remain in the shadows. Thus, it is recommended to consider buying the pound when the price settles above the descending channel with initial targets on the Senkou Span B (1.3266) and Kijun-sen (1.3310) lines. Take Profit in this case will be from 30 to 70 points.
2) Bears continue to slowly pull down the pair, therefore, short positions remain relevant while aiming for the support area of 1.3004-1.3024, but you are advised to resume trading down if the price manages to overcome the support level of 1.3139, which has already been reached yesterday. Take Profit in this case will be about 100 points.
Explanations for illustrations:
Support and Resistance Levels are the levels that serve as targets when buying or selling the pair. You can place Take Profit near these levels.
Kijun-sen and Senkou Span B lines are lines of the Ichimoku indicator transferred to the hourly timeframe from the 4-hour one.
Support and resistance areas are areas from which the price has repeatedly rebounded off.
Yellow lines are trend lines, trend channels and any other technical patterns.
The material has been provided by InstaForex Company - www.instaforex.com