Crypto Industry News:
According to data from BitInfoCharts, yesterday's average Ethereum transaction fee was $ 2,248. It hit $2.28, 4 cents more on August 23, but has not fallen below $ 2,248 since August 9, when the cost of an average Ethereum transaction was $1.94.
Just ten days ago, the average cost of a single Ethereum transaction was $11.6, and on September 2, $14.6. These were the highest fees in the history of the entire network. The gas price was close to these levels in 2018 at the earliest, and was then $5.5.
Fees go up when there aren't enough miners to process your transactions. If the charges are lower, it means less network activity. One of the reasons for the high fees during these holidays was the rapid development of decentralized finance (DeFi). DeFi is a series of decentralized financial products such as loan protocols, decentralized stablecoins and synthetic assets.
A lot of money has been poured into these protocols over the past few months. According to DeFi Pulse, currently about USD 11 billion is blocked in DeFi smart contracts. In June, it was only 1 billion, so the entire sector of decentralized finance grew by 1100%. The largest DeFi smart contracts are placed in the Ethereum blockchain. However, the ETH network can only process 14 transactions per second, so it is unable to keep up with demand.
Declining fees may mean that activity in the DeFi sector is also declining. Perhaps people are starting to move to other blockchains. It could also mean that people rely on second-tier solutions - software built into the Ethereum blockchain to make transactions cheaper or faster - or that DeFi smart contracts become more efficient or simply contain fewer transactions. Whatever the reason, investors are sure to enjoy lower gas prices.
Technical Market Outlook:
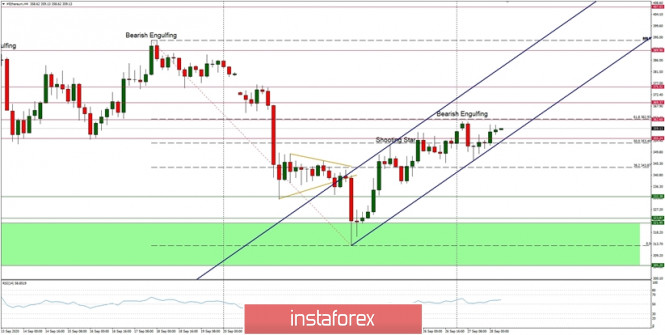
The ETH/UD pair has almost hit the level of $362.93, which is a 61% Fibonacci retracement of the last wave down. The recent local high was made at the level of $361.88, so it was just a little below the retracement level. Nevertheless, the Bearish Engulfing candlestick pattern had been made already, so the bears are now trying to stop to corrective wave up and reverse the market back to the down trend. The momentum is still strong and positive, so the bulls did not give up yet and are waiting for the opportunity to break out higher. The next technical resistance is seen at the level of $369.37 and the nearest technical support is located at the level of $345.40. The weekly time frame trend remains up.
Weekly Pivot Points:
WR3 - $446.64
WR2 - $410.95
WR1 - $384.24
Weekly Pivot - $347.99
WS1 - $319.88
WS2 -$284.46
WS3 - $256.92
Trading Recommendations:
The weekly and monthly time frame trend on the ETH/USD pair remains up and there are no signs of trend reversal, so buy orders are preferred in the mid-term. The key mid-term technical support is currently seen at the level of $305.20 - $321.95, so all the dynamic corrections are still being used to buy the dips. The next mid-term target for bulls is seen at the level of $500.

