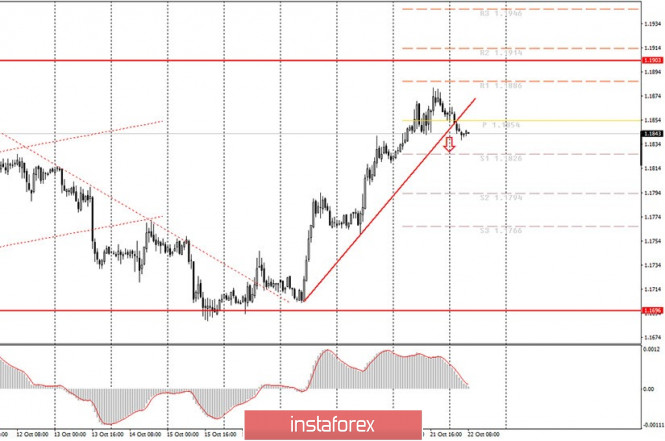
Hourly chart of the EUR/USD pair

The EUR/USD pair started a downward correction last Wednesday night, which only made the technical picture even more confusing. Now several scenarios are possible at once. First, the correction, which is why the price settled below the upward trend line, can really only be a correction. In this case, you will have to rebuild the trend line, since it initially had a very strong slope and almost any pullback took the pair below it. Secondly, the trend could change to a downward one, since the euro/dollar pair approached the 1.1900 level once again, which for a long time acted as the upper border of the 1.17-1.19 horizontal channel. We mentioned last night that the likelihood of a downward reversal near the 1.1900 level is quite high. However, quotes did not reach this level, nevertheless, a reversal may occur on the way to it. Moreover, if the trend changes to a downward one and now we are waiting for it to move to 1.1700, then the pair may correct upward before continuing to move down, therefore, in the near future, the MACD indicator may turn up. In general, the situation is complex.
The fundamental background for the EUR/USD pair remains unchanged. The euro has significantly grown in recent days, but, as we have already said, there is a high likelihood that its quotes will remain within 1.17-1.19. Traders continue to ignore all macroeconomic reports, and the fundamental background is quite contradictory, since there is essentially no new, important information and messages on key topics for the pair. For example, today the calendar of macroeconomic events does not contain anything interesting at all. There will only be a report on claims for unemployment benefits in America, which traders mostly brush off (except for force majeure cases). Therefore, they will either have to trade again exclusively on technical factors and signals, or else look for news on the European Union and the United States and try to understand whether they can have any influence on the course of trading. It would seem that an epidemic is raging in both the US and the EU, America is approaching the presidential elections.
The last round of televised debates between Donald Trump and Joe Biden will take place in the United States, Democrats and Republicans still cannot agree on an aid package for the American economy. However, all these topics only create a general background, and the daily trades are not based on them. As we mentioned earlier, it will be difficult for the dollar to rise before the elections. Therefore, we do not expect the pair below the 1.1700 level.
Possible scenarios for October 22:
1) Buy positions on the EUR/USD pair have ceased to be relevant at the moment, since the price has settled below the rising trend line. At the same time, the upward trend may still resume. However, we do not recommend novice traders to make complex trading decisions, but instead they should rely on clearer and simpler signals. Thus, it is best to resume bull trading after a new upward trend or downward trend refracts.
2) Novice traders are advised to return to selling the pair, since the price has settled below the trend line. For sell positions that are already open, we recommend keeping them with targets at 1.1826 and 1.1794 until the MACD turns up. For new short positions, you should wait for an upward correction and a new MACD sell signal. The goals are the same.
On the chart:
Support and Resistance Levels are the Levels that serve as targets when buying or selling the pair. You can place Take Profit near these levels.
Red lines are the channels or trend lines that display the current trend and show in which direction it is better to trade now.
Up/down arrows show where you should sell or buy after reaching or breaking through particular levels.
The MACD indicator (14,22,3) consists of a histogram and a signal line. When they cross, this is a signal to enter the market. It is recommended to use this indicator in combination with trend lines (channels and trend lines).
Important announcements and economic reports that you can always find in the news calendar can seriously influence the trajectory of a currency pair. Therefore, at the time of their release, we recommended trading as carefully as possible or exit the market in order to avoid a sharp price reversal.
Beginners on Forex should remember that not every single trade has to be profitable. The development of a clear strategy and money management are the key to success in trading over a long period of time.
The material has been provided by InstaForex Company - www.instaforex.com