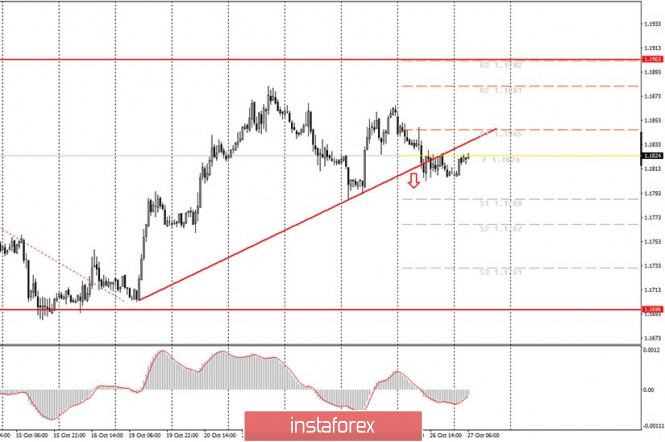
Hourly chart of the EUR/USD pair

The EUR/USD pair tried to start an upward correction several times after the rising trend line was broken last Monday night. Recall that yesterday evening we warned traders that it is risky to open short positions right away and it is better to wait for the upward correction and discharge of the MACD indicator. The downward movement did not continue last night, and the correction did not start. Thus, the situation is becoming more and more ambiguous day by day. On the one hand, the price crossed the upward trend line twice, so the pair should start forming a downward trend inside the horizontal channel of $1.17-1.19. On the other hand, the pair can neither correct nor continue falling. The MACD indicator managed to slightly discharge to the zero mark, so when new sell signals are formed, they can still be worked out. But take note that the pair is unlikely to fall below the 1.1696 level. And, of course, the fundamental background...
The fundamental background for the EUR/USD pair remains the same and does not change. What does this mean? This means that the background that brought the pair to the current levels from $1.07-1.08 is still present. That is why the US dollar cannot even correct normally and will settle below 1.1700. Traders are simply afraid to make strong purchases of the US currency, since there is no reason for this. However, it is difficult for the euro to grow further, as it has risen in price by more than 10 cents over the past six months. Thus, a stalemate has developed, from which the quotes have not been able to get out for three months. Well, market participants should only continue to trade within the horizontal channel and in parallel wait for the flat to end (in the long term). Perhaps this problem will be resolved as early as next Tuesday, when Election Day is held in America. Perhaps a little later, when the votes are counted. Perhaps even later, when the election results become known. One way or another, some kind of factor is necessary for force traders to withdraw the pair from the annoying 1.17-1.19 channel. The US is set to release one macroeconomic report today, which theoretically could have an impact on the pair's movement. Durable goods orders are considered a fairly important report. However, last month the real values of four of its indicators turned out to be extremely boring and neutral, fixing minimal changes. The same can be true today. Forecasts for four indicators (general indicator, indicator excluding defense and aviation orders, indicator excluding defense and indicator excluding transport) expect growth by 0.7%. Therefore, if these forecasts are greatly exceeded, the US dollar will have the opportunity to go back to rising (= fall of the euro/dollar pair). And vice versa.
Possible scenarios for October 27:
1) Buy positions on the EUR/USD pair are no longer relevant at the moment, since the upward trend line did not resist the onslaught of bears. Therefore, in the near future the pair should continue to move down, and you can only consider long deals after a new upward trend or an eloquent cancellation of the downward trend has occurred.
2) Trading for a fall at this time has become relevant, since the price has not stayed above the trend line. Novice traders are advised to wait until the correction has been completed, afterwards you can open short positions while aiming for 1.1788 and 1.1767 on the MACD sell signal. If this signal is quickly canceled and the downward movement does not continue, you are advised to leave the market until the next recommendations.
On the chart:
Support and Resistance Levels are the Levels that serve as targets when buying or selling the pair. You can place Take Profit near these levels.
Red lines are the channels or trend lines that display the current trend and show in which direction it is better to trade now.
Up/down arrows show where you should sell or buy after reaching or breaking through particular levels.
The MACD indicator (14,22,3) consists of a histogram and a signal line. When they cross, this is a signal to enter the market. It is recommended to use this indicator in combination with trend lines (channels and trend lines).
Important announcements and economic reports that you can always find in the news calendar can seriously influence the trajectory of a currency pair. Therefore, at the time of their release, we recommended trading as carefully as possible or exit the market in order to avoid a sharp price reversal.
Beginners on Forex should remember that not every single trade has to be profitable. The development of a clear strategy and money management are the key to success in trading over a long period of time.
The material has been provided by InstaForex Company - www.instaforex.com