EUR/USD 1H

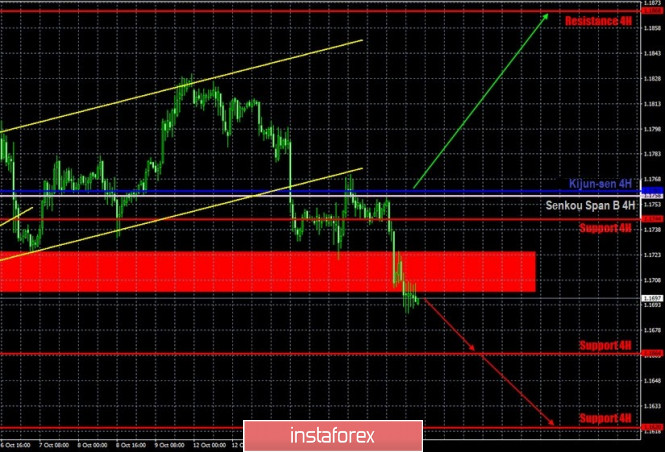
The euro/dollar pair resumed its downward movement and quite easily overcame the support area of 1.1701-1.1725 on the hourly timeframe on October 15, and with it the Senkou Span B line, which is considered to be quite strong resistance. However, the bears have been active recently and are confidently pulling down the pair. Therefore, the pair may continue to move down with targets at 1.1664 and 1.1620. As for the bulls' prospects, they are put aside for now. However, at the same time, please be reminded that when the US dollar strengthens when the pair falls. And the current fundamental background does not imply strong dollar growth. Thus, it is possible that the quotes will stop falling soon.
EUR/USD 15M

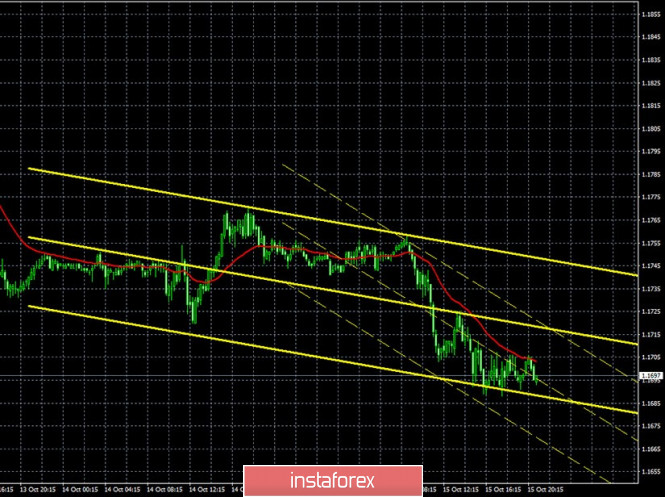
Both linear regression channels are still directed to the downside on the 15-minute timeframe, which is fully consistent with the picture of what is happening on the hourly timeframe. The lower charts do not provide any signs of completing the correction cycle on the 1-hour timeframe.
COT report

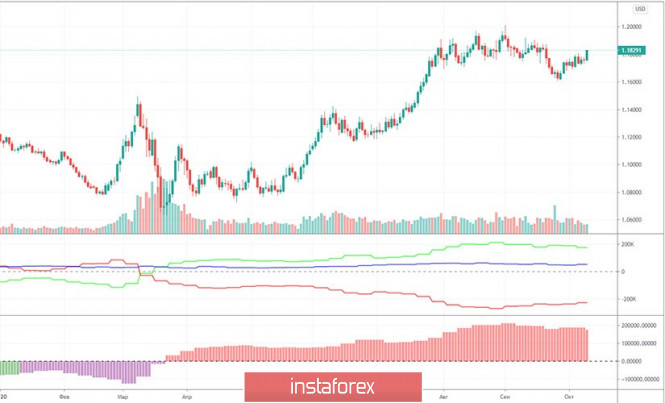
The EUR/USD pair has risen in price by about 120 points during the last reporting week (September 29 - October 5). But in general, there are still no significant price changes for the pair. In fact, all trades are held in a horizontal range of 250-300 points. Thus, data from any Commitment of Traders (COT) report can only be used for long-term forecasting. The latest COT report showed that non-commercial traders, which we recall, are the most important group of traders in the forex market, closed 10,784 Buy-contracts (longs) and opened 2,078 Sell-contracts (shorts). Take note that two weeks earlier, the "non-commercial" group was relatively active in building up long positions, but now it is decreasing its net position for the second consecutive week. This may indicate that the upward trend for the pair is over. Or it is about to end. We have already said that the lines of the net positions of the "commercial" and "non-commercial" groups (upper indicator, green and red lines) diverge strongly when a trend change occurs. If this is the case, the peak point of the upward trend will remain at $1.20. The net position of non-commercial traders was at its highest (green line) at this point. After reaching this level, it falls steadily. Thus, the pair may try to make another upward breakthrough as a final assault on the bulls, but you should hardly expect the pair to go much higher than the 20 figure.
No macroeconomic background for EUR/USD on Thursday, October 15. No important news from the European Union, while the dollar continued to rise. However, the problem is that there was no important news from America either, and there were no important macroeconomic publications. Thus, we can conclude that the US dollar did not grow due to the fundamental background or macroeconomic reports. Or at least due to an event. Therefore, we continue to give preference to technical factors, since it is very difficult to predict anything based on fundamental events right now. We have already said that the main conflict lies in the fact that the bulls are afraid to buy the euro around its two-year highs, and the bears do not have sufficient grounds to sell the pair, which means buying the dollar, since the level of uncertainty in the US is just going through the roof. And with the elections approaching, the situation on the foreign exchange market can only escalate. Quite often, when an important event is approaching, which may carry consequences of extreme importance (not only for the United States, but for the whole world), panic begins in the markets. And it is not at all necessary that the US dollar will fall in price. An example is the pound/dollar pair, which has been moving from side to side for two weeks.
We have two trading ideas for October 16:
1) The pair has left the ascending channel, so buyers are not dominant in the forex market now. You can only consider to take new long positions if the quotes return to the area above the critical line (1.1775) and then you can aim for the resistance level of 1.1868 and even then, only in small lots. Take Profit in this case will be up to 80 points. This scenario is not expected to come true in the near future.
2) Bears overcame the important support area of 1.1701-1.1725 on the second try. Thus, sellers have an opportunity to trade short with targets at the support levels of 1.1664 and 1.1620. The potential Take Profit in this case is from 30 to 70 points. Not much, but the current volatility remains low.
Explanations for illustrations:
Support and Resistance Levels are the levels that serve as targets when buying or selling the pair. You can place Take Profit near these levels.
Kijun-sen and Senkou Span B lines are lines of the Ichimoku indicator transferred to the hourly timeframe from the 4-hour one.
Support and resistance areas are areas from which the price has repeatedly rebounded off.
Yellow lines are trend lines, trend channels and any other technical patterns.
The material has been provided by InstaForex Company - www.instaforex.com