EUR/USD 1H

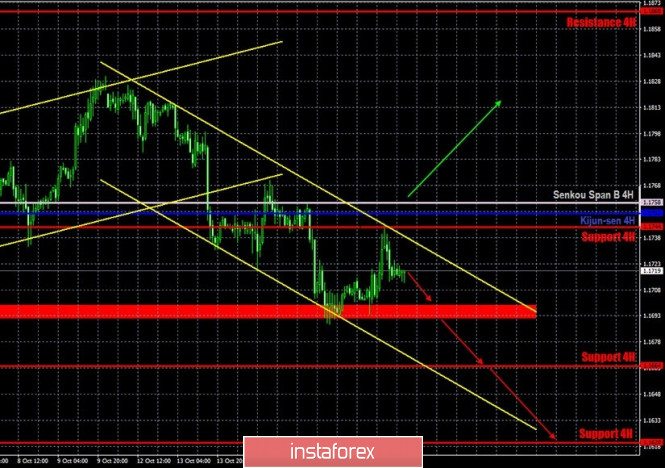
The euro-dollar pair was unable to overcome the support area of 1.1692-1.1699 on the hourly timeframe on October 16, instead the pair rebounded off it and traded higher for most of the day, reaching the upper line of the descending channel. The downward movement resumed since it failed to go beyond its limits. Thus, buyers have shown that they are rather weak. On the other hand, take note that the pair continues to almost trade in a horizontal channel with vague borders, which is clearly visible on higher timeframes. Therefore, the bulls and bears simply alternate their trends on the hourly timeframe. It is possible that sellers may not be able to overcome the support area of 1.1692-1.1699, from which the price has repeatedly rebounded off.
EUR/USD 15M

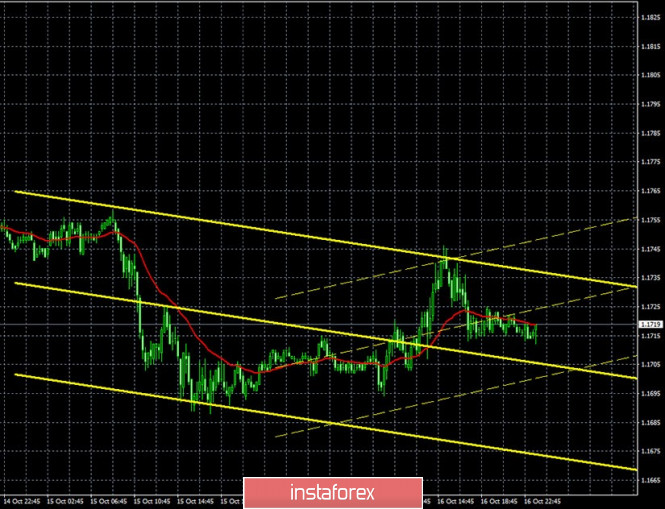
The lower linear regression channel turned to the upside on the 15-minute timeframe, indicating that a correction is about to start and an unsuccessful attempt to overcome the 1.1692-1.1699 area. The future prospects of the pair will depend on this particular area.
COT report

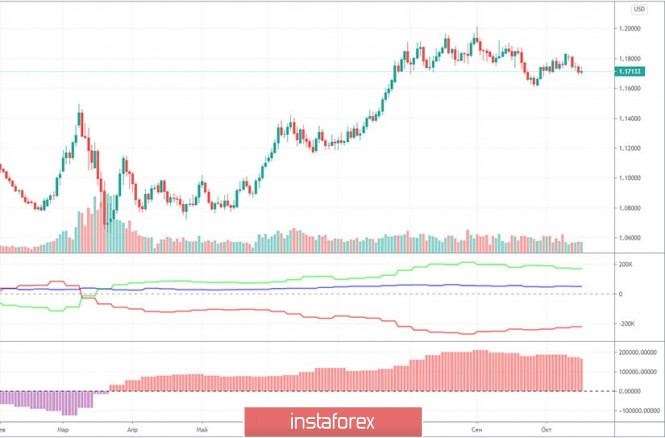
The EUR/USD pair has grown by around 30 points during the last reporting week (October 6-12). This is very small and, as a whole, there are still no significant price changes for the pair. Trades are held in a horizontal range of 250-300 points. Therefore, data from any COT report can only be used for long-term forecasting. Nonetheless, pro traders continue to become more and more bearish. We remind you that the most important group of traders is called "non-commercial". This group closed 2,500 Buy-contracts (longs) and opened 5,300 Sell-contracts (shorts) during the reporting week. Thus, the net position for this group immediately fell by 7,800. At the same time, the "commercial" group, which almost always trades in the opposite direction, has become more bullish. This group of traders increased their net position by 10,000 contracts at once. The first indicator continues to signal the convergence of the lines of net positions of these two groups of traders. We remind you that when the green and red lines diverge strongly, this is a signal of an impending reversal of the trend globally. Now these lines have begun to narrow, so we can assume that the high around the 1.20 level will remain the peak of the entire uptrend.
The macroeconomic background for the pair remained unchanged on Friday, October 16, since we did not receive any important news for the euro or the dollar. Several rather important reports were published during the day, which were, as always, ignored by market participants. Nevertheless, inflation in the European Union remained at an unprecedented level of -0.3% y/y. That is, in fact, deflation that has been going on. So far, traders do not react to this indicator in any way. Possibly because deflation is driven in part by the euro's sharp rise over the past six months. Or perhaps because market participants still fear the uncertainty associated with the US presidential elections, which are only two weeks away. However, we are now still inclined to believe that the euro will begin to slightly fall. First of all, the Commitment of Traders (COT) report supports this. Secondly, a full-scale second wave of coronavirus has begun in Europe. There are anti-morbidity records in many European countries. This affects the pace of economic recovery after the first wave, respectively, the euro's appeal is also decreasing in international markets. Also a fairly strong report on retail sales was released in the United States on Friday, which showed an increase of as much as 1.9% m/m. Unfortunately, industrial production was disappointing, which turned out to be negative, while traders were expecting a 0.6% gain.
We have two trading ideas for October 19:
1) The pair continues to trade within a new descending channel, so buyers are not dominant in the forex market now. You can consider long positions if the quotes return to the area above the critical line (1.1752) and the Senkou Span B line (1.1758), while aiming for the resistance level of 1.1868. Take Profit in this case will be up to 100 points. We do not expect this scenario to come true in the near future.
2) Bears continue to hold the initiative, but cannot overcome the 1.1692-1.1699 support area for now. Thus, sellers can now open short positions with targets at the 1.1664 and 1.1620 support levels if this area is overcome. The potential Take Profit in this case is from 20 to 60 points. Not much, but the current volatility remains low.
Explanations for illustrations:
Support and Resistance Levels are the levels that serve as targets when buying or selling the pair. You can place Take Profit near these levels.
Kijun-sen and Senkou Span B lines are lines of the Ichimoku indicator transferred to the hourly timeframe from the 4-hour one.
Support and resistance areas are areas from which the price has repeatedly rebounded off.
Yellow lines are trend lines, trend channels and any other technical patterns.
The material has been provided by InstaForex Company - www.instaforex.com