EUR/USD 1H

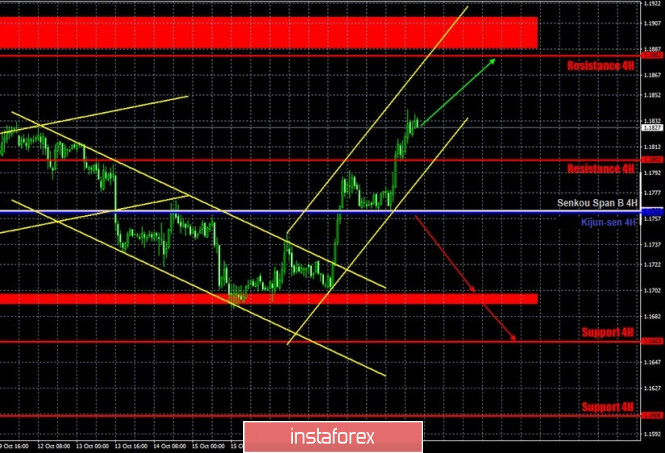
The euro/dollar pair continued to rise on the hourly timeframe on October 20. From a fundamental point of view, it is still impossible to substantiate this movement. Nevertheless, the pair's quotes rebounded from the Senkou Span B line in the morning and began a new upward movement, breaking the Senkou Span B line along the way. We also managed to form a new rising channel that supports growth, and getting the price to settle below it indicates that the trend could change into a downward one in the short term. Buyers have a real chance of bringing the pair to the 1.1882 level. Moving further up is still in doubt, since the price as a whole continues to remain within the long-term horizontal channel, approximately at 1.1640-1.1920.
EUR/USD 15M

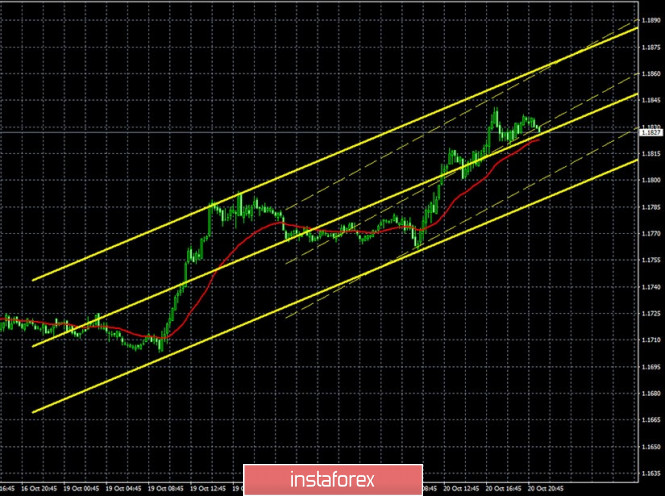
Both linear regression channels are directed to the upside on the 15-minute timeframe, signaling an upward movement after an unsuccessful attempt to overcome the 1.1692-1.1699 area.
COT report

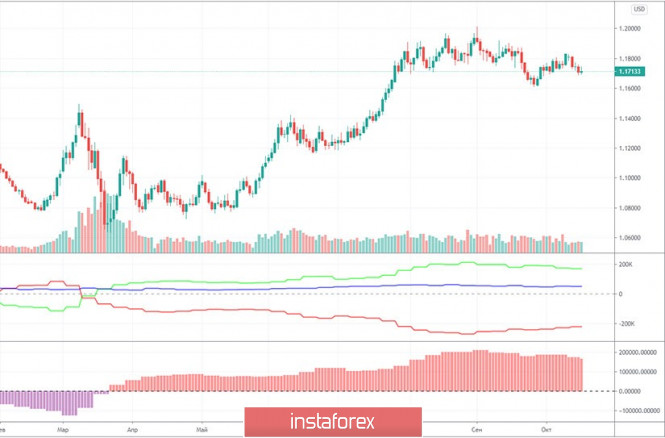
The EUR/USD pair has risen in price by around 30 points during the last reporting week (October 6-12). This is very small and, as a whole, the price has not significantly changed. Trades are held in a horizontal range of 250-300 points. Therefore, data from any COT report can only be used for long-term forecasting. Nonetheless, pro traders continue to become more and more bearish. We remind you that the most important group of traders is called "non-commercial". This group closed 2,500 Buy-contracts (longs) and opened 5,300 Sell-contracts (shorts) during the reporting week. Thus, the net position for this group immediately fell by 7,800. At the same time, the "commercial" group, which almost always trades in the opposite direction, has become more bullish. This group of traders increased their net position by 10,000 contracts at once. The first indicator continues to signal the convergence of the lines of net positions of these two groups of traders. We remind you that when the green and red lines diverge strongly, this is a signal of an impending reversal of the trend globally. Now these lines have begun to narrow, so we can assume that the high around the 1.20 level will remain the peak of the entire uptrend.
The macroeconomic background for the pair was essentially absent on Tuesday despite the fact that the euro continued to rise. However, not a single important report was published during the day, not even an important speech. It's just that the euro is getting more expensive at this time and that's it. We remind you that everything in the foreign exchange market depends solely on supply and demand for a particular currency, and technical, fundamental and other types of analysis are only tools that allow you to predict the future price movement. Therefore, if some central bank urgently needed to buy the euro, then the demand for the single currency is growing, and accordingly, its rate will increase, and the fundamental background is completely empty or unchanged. Moreover, we remind you that all trades of the last three months continue to take place in a horizontal channel, so now we have witnessed just a new round of upward movement within this very channel. European Central Bank President Christine Lagarde is set to deliver another speech on Wednesday, who continues to speak almost every two days. We can also expect a speech from ECB Vice President Luis de Guindos. There are no major events scheduled in the United States for today.
We have two trading ideas for October 21:
1) The pair continues to rise, now inside the upward channel. Thus, traders are advised to continue to trade up with targets at the resistance level of 1.1882 as long as the price is within the trend channel. Take Profit in this case will be up to 50 points. Also, the Kijun-sen line can be used as a reference point for maintaining the upward trend.
2) Bears have let go of the initiative, having failed to overcome the support area of 1.1692-1.1699. Thus, now sellers can only wait for the bulls to take a break. You can consider the possibility of opening short positions after breaking the Kijun-sen line (1.1763) while aiming for the support area of 1.1692-1.1699 and the level of 1.1663. The potential Take Profit in this case is from 30 to 70 points.
Explanations for illustrations:
Support and Resistance Levels are the levels that serve as targets when buying or selling the pair. You can place Take Profit near these levels.
Kijun-sen and Senkou Span B lines are lines of the Ichimoku indicator transferred to the hourly timeframe from the 4-hour one.
Support and resistance areas are areas from which the price has repeatedly rebounded off.
Yellow lines are trend lines, trend channels and any other technical patterns.
The material has been provided by InstaForex Company - www.instaforex.com