EUR/USD 1H

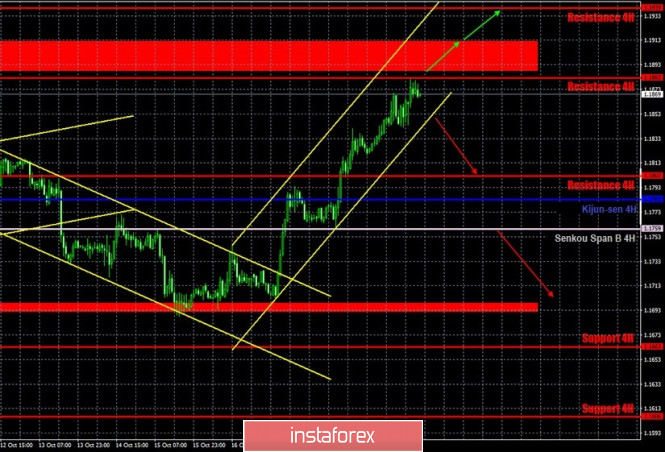
The EUR/USD pair continued to move up on the hourly timeframe on Wednesday, October 21, without any sign of starting a correction. The price continued to trade within the rising channel throughout the day and did not make any attempt to leave it. The resistance level of 1.1882 was reached by the end of the day. Thus, buyers have not let go of the initiative for the third day now, which made it possible for the euro to sharply rise against the US dollar. Now the bulls need to break through an important resistance area of 1.1887-1.1912 in order to expect stronger gains. However, take note that the 1.1900 area has been the upper line of the horizontal channel for a long time. And even the 1.1940 level is also the upper line of the horizontal channel, only different. Thus, there are several important and strong resistances above 1.1900 and buyers will need a really strong desire to overcome them.
EUR/USD 15M

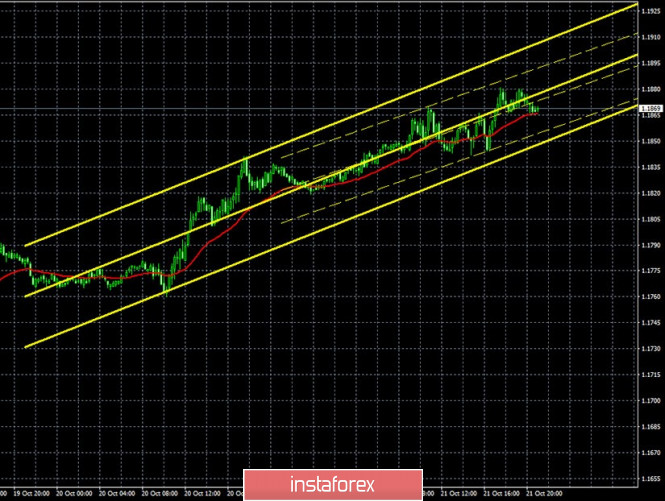
Both linear regression channels are directed upward on the 15-minute timeframe, indicating that the upward movement will continue after a failed attempt to overcome the 1.1692-1.1699 area.
COT report

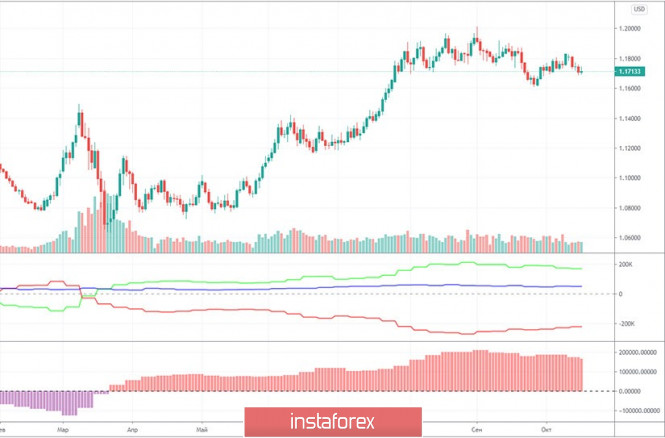
The EUR/USD pair has risen in price by around 30 points during the last reporting week (October 6-12). This is very small and, as a whole, the price has not significantly changed. Trades are held in a horizontal range of 250-300 points. Therefore, data from any COT report can only be used for long-term forecasting. Nonetheless, pro traders continue to become more and more bearish. We remind you that the most important group of traders is called "non-commercial". This group closed 2,500 Buy-contracts (longs) and opened 5,300 Sell-contracts (shorts) during the reporting week. Thus, the net position for this group immediately fell by 7,800. At the same time, the "commercial" group, which almost always trades in the opposite direction, has become more bullish. This group of traders increased their net position by 10,000 contracts at once. The first indicator continues to signal the convergence of the lines of net positions of these two groups of traders. We remind you that when the green and red lines diverge strongly, this is a signal of an impending reversal of the trend globally. Now these lines have begun to narrow, so we can assume that the high around the 1.20 level will remain the peak of the entire uptrend.
No macroeconomic background for the pair on Wednesday, despite the fact that the euro continued to rise for the third consecutive day. There was little news of a macroeconomic nature; European Central Bank President Christine Lagarde and Vice President Luis de Guindos did not disclose anything interesting during their speeches. But new, funny information from America appeared. So the American media found out that US President Donald Trump's company has an account opened in one of the Chinese banks. Moreover, between 2013 and 2015, Trump's company paid nearly $200,000 in taxes to the Chinese treasury. And while Trump has been repeatedly accused of concealing the real income of his companies and tax evasion. However, Trump himself did not remain in debt and said that the FBI should start an investigation into the business of Joe Biden and Hunter Biden. According to Trump, "this is a very large corruption case." Trump continues to insist that in Ukraine, China and the Bidens were involved in many "dark" deals and insists on their investigation. This probe is unlikely to begin and end before Election Day.
We have two trading ideas for October 22:
1) The pair continues to move up within the rising channel. Thus, traders are advised to continue to trade bullish while aiming for the 1.1939 resistance level as long as the price is within the trend channel. Take Profit in this case will be up to 50 points. However, one should take into account the 1.1887-1.1912 area, which the bulls may not be able to overcome.
2) Bears remain in the shadows. Thus, now the bears can only wait for the bulls to take a break. The opportunity to open short positions will appear after breaking the Kijun-sen (1.1783) and Senkou Span B (1.1759) lines with the targets of the support area of 1.1692-1.1699 and the 1.1663 level. The potential Take Profit in this case is from 50 to 80 points. You can also consider shorts in small lots while aiming for the Kijun-sen line, if the bears get the pair to settle below the rising channel.
Explanations for illustrations:
Support and Resistance Levels are the levels that serve as targets when buying or selling the pair. You can place Take Profit near these levels.
Kijun-sen and Senkou Span B lines are lines of the Ichimoku indicator transferred to the hourly timeframe from the 4-hour one.
Support and resistance areas are areas from which the price has repeatedly rebounded off.
Yellow lines are trend lines, trend channels and any other technical patterns.
The material has been provided by InstaForex Company - www.instaforex.com