EUR/USD 1H

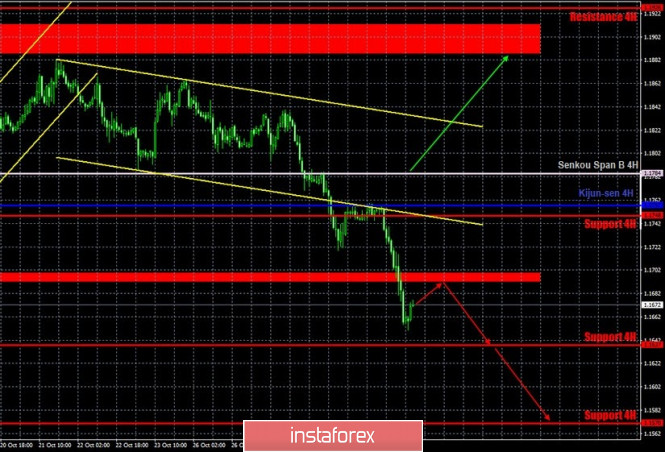
The EUR/USD pair has sharply resumed its downward movement on the hourly timeframe on Thursday, October 29, practically without any correction. The support area of 1.1693-1.1700 was overcome, which was the lower line of the horizontal channel at 1.17-1.19, in which the pair has been trading for three months. On the one hand, everything is clear: the lower boundary of the channel has been overcome, which means the downward movement will continue. However, on the other hand, if you look at the higher charts, you can see that the pair had already crossed this area once before, but the bears then managed to pull down the pair by only 80 points, after which the quotes quickly returned to the horizontal channel. So something like this could happen now. Take note that the fundamental background for both the euro and the dollar remains very diverse and complex, as well as ambiguous. Therefore, the pair could grow again at any moment.
EUR/USD 15M

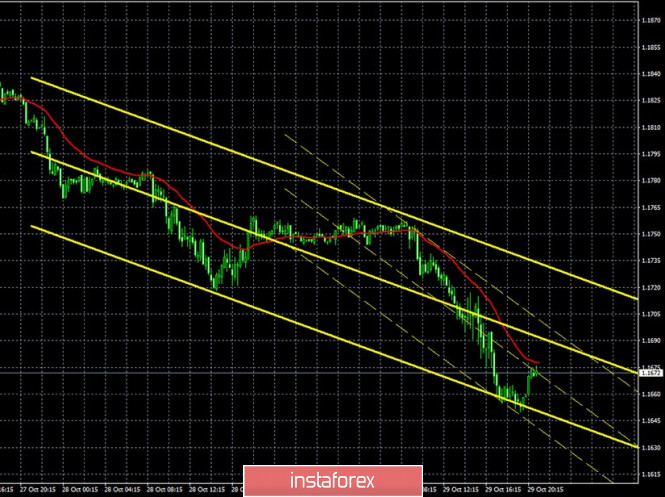
Both linear regression channels are directed to the downside on the 15-minute timeframe, which eloquently indicates the current trend on the hourly chart and shows that there are no signs of completing the downward movement.
COT report

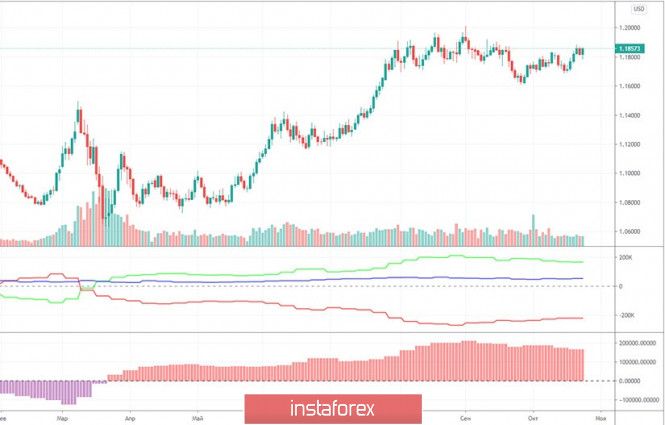
The EUR/USD pair fell by around 40 points during the last reporting week (October 13-19). But in general, no significant price changes have been observed for the pair in recent months. Therefore, data from any Commitment of Traders (COT) report can only be used for long-term forecasting. The new COT report showed even fewer changes in the mood of professional traders than the previous one. Non-commercial traders, who, we recall, are the most important group of traders in the foreign exchange market, opened 1,081 Buy-contracts (longs) and 673 Sell-contracts (shorts). Take note that the "non-commercial" group decreased its net position in the last two weeks, which may indicate the end of the upward trend. However, the data provided by the latest COT report does not tell us anything at all. There are no changes, since non-commercial traders have opened almost 300,000 euro contracts. Thus, opening or closing of 1,000-2.000 contracts does not indicate anything. The lines of net positions of the "non-commercial" and "commercial" groups (upper indicator, green and red lines) continue to barely narrow, while the pair itself continues to trade in a horizontal channel. Therefore, we stick to our opinion - the upward trend is completed or is about to be completed, and the high reached near the 1.2000 level may remain the peak of this trend.
The US just released its third-quarter GDP report in its first estimate. Recall that the American economy contracted by 31% in the second quarter, but in the third quarter it grew by 33%. Traders received the news with a bang and actively bought the dollar. Also, the results of the European Central Bank meeting were summed up yesterday. As expected, the rates remained unchanged, but ECB President Christine Lagarde's rhetoric during the press conference, as they say, finished off the euro. Lagarde said: "The data signals that the economic recovery in the eurozone is losing momentum faster than expected, after a strong, albeit partial recovery in economic activity during the summer months." Lagarde believes that the increase in the number of cases of coronavirus represents a new serious threat to the European economy. Lagarde also noted that business activity in the service sector is declining, and significantly. Inflation, according to Lagarde, will also experience negative pressure for a long time to come. Such rhetoric caused a sell-off in the euro currency.
We have two trading ideas for October 30:
1) The EUR/USD pair went down. Thus, buyers are advised to resume trading upward while aiming for the resistance area of 1.1887-1.1912 but not before the quotes have settled above the descending channel, below which the price has already gone very far. Take Profit in this case can be up to 70 points. Thus, we do not expect this scenario to come true in the near future. The price is too far away even from the Kijun-sen line.
2) Bears continue to actively pull down the pair. Thus, sellers are advised to continue trading down while aiming for the support levels of 1.1637 and 1.1570. A price rebound from any target can trigger a round of corrective movement. Take Profit in this case can be up to 70 points.
Hot forecast and trading signals for GBP/USD
Explanations for illustrations:
Support and Resistance Levels are the levels that serve as targets when buying or selling the pair. You can place Take Profit near these levels.
Kijun-sen and Senkou Span B lines are lines of the Ichimoku indicator transferred to the hourly timeframe from the 4-hour one.
Support and resistance areas are areas from which the price has repeatedly rebounded off.
Yellow lines are trend lines, trend channels and any other technical patterns.
Indicator 1 on the COT charts is the size of the net position of each category of traders.
Indicator 2 on the COT charts is the size of the net position for the "non-commercial" group.
The material has been provided by InstaForex Company - www.instaforex.com