GBP/USD 1H

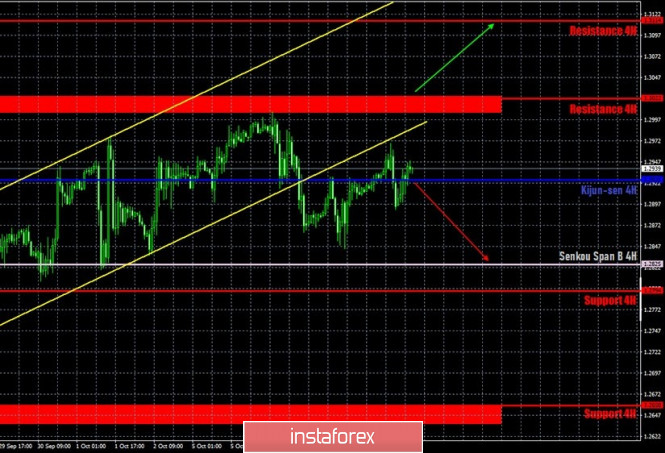
The GBP/USD pair continued to trade slightly below the ascending channel and ignored the Kijun-sen line on October 8, which in theory is a strong line that does not allow you to easily overcome it three times a day. However, specifics are now such that many lines are ignored, and not only for the pound/dollar pair. A similar picture is observed for the euro/dollar pair. Thus, traders failed to settle above the resistance area of 1.3004-1.3024, and then they left the ascending channel. These are two factors that are in favor of continuing the downward movement. Nevertheless, sellers failed to approach the Senkou Span B line over the past two days, settling below it could become the third factor in favor of a downward movement. Thus, a flat between the levels of 1.2825 and 1.3000 is not excluded right now.
GBP/USD 15M

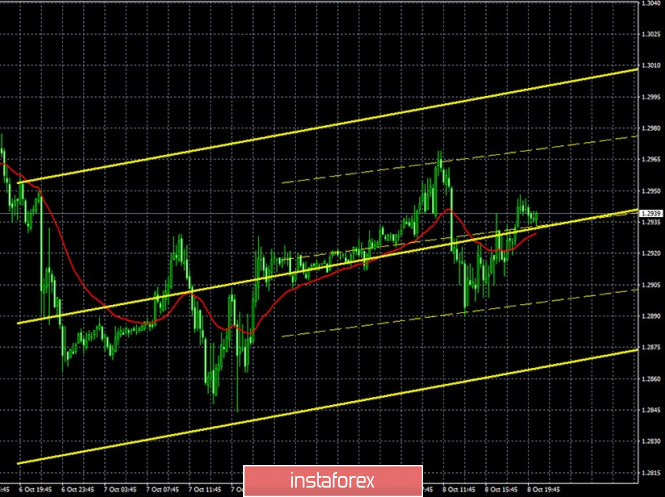
Both linear regression channels turned upward on the 15-minute timeframe, which is a sign of returning the upward movement on the hourly timeframe. As we mentioned above, the Senkou Span B line at 1.2825 is a serious resistance for the downward movement. Therefore, a flat is possible, and both channels will constantly turn in different directions in a flat.
COT report

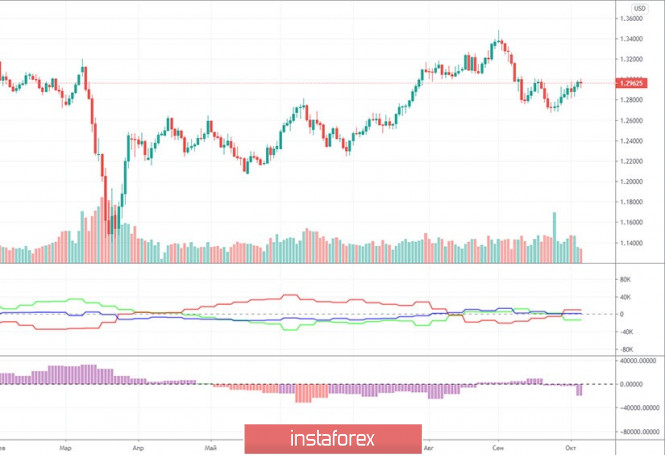
The latest Commitments of Traders (COT) report for the British pound showed that non-commercial traders started to open high-volume sell contracts. In total, 12,000 Sell-contracts (shorts) were opened from September 23-29. At the same time, the "non-commercial" group of traders also closed around 4,000 Buy-contracts (longs). That is, the net position for this category of traders suddenly decreased by 16,000, which is a lot for the pound, given that there are about 100,000 contracts open at this time. The sentiment of non-commercial traders has become much more bearish. However, the pound only rose in price from September 23-29. It did not grow much, only 140 points, and continues to move up, very uncertainly if I may add. We tend to think that the pound will resume falling in the near future (based on the latest COT reports). As for the indicators, they do not show anything extraordinary now, according to the COT reports. They do not signal a possible global reversal of the pair. Only that non-commercial traders believe more in the dollar's growth rather than the pound (lower indicator).
No major macroeconomic reports from the UK or America on Thursday, October 8. Traders had nothing to react to. At the same time, even if they had such an opportunity, it is unlikely that they would have a desire to do so. Recall that in the past six months, about 80-90% of all statistics were not taken into account by the markets. This is easy to explain. The coronavirus crisis has swept all countries. Especially the European Union, Great Britain and the United States. Thus, positive data on the recovery of a particular economy have, in fact, no value, because all economies fell synchronously due to lockdowns, all economies are recovering synchronously. In the past six months, the US dollar has been prone to fall, the US economy suffered the largest losses in GDP in the second quarter. Traders have worked it out with interest, and they do not pay attention to other, less important reports. Today, Britain will publish its GDP data for August and September, as well as a report on industrial production for August. In theory, these reports can contribute to more active trading in the pound/dollar pair and trend movement at least within the day.
We have two trading ideas for October 9:
1) Buyers have let go of the initiative. Thus, you can formally consider long positions while aiming for the resistance area of 1.3000-1.3024, if the price returns to the area above the critical line (1.2918), however, we advise you to be very careful when doing this or not at all, since the price crossed this line several times for the last 24 hours. Take Profit in this case will be up to 70 points.
2) Sellers seem to have tried to seize the initiative, but so far they clearly lack the strength to build on their success. Bears need to overcome the Senkou Span B line (1.2825), we advise that you only resume trading down in this case, and then you can aim for the support level of 1.2658. Take Profit in this case can range from 70 to 100 points.
Explanations for illustrations:
Support and Resistance Levels are the levels that serve as targets when buying or selling the pair. You can place Take Profit near these levels.
Kijun-sen and Senkou Span B lines are lines of the Ichimoku indicator transferred to the hourly timeframe from the 4-hour one.
Support and resistance areas are areas from which the price has repeatedly rebounded off.
Yellow lines are trend lines, trend channels and any other technical patterns.
The material has been provided by InstaForex Company - www.instaforex.com