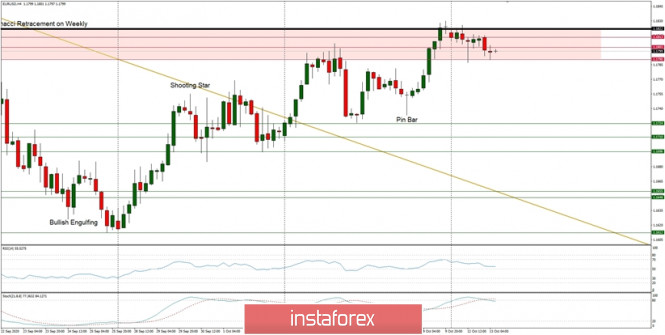
Technical Market Outlook:
The EUR/USD pair has hit the level of 1.1822 again. This is the 61% Fibonacci retracement level on the weekly time frame chart and had been tested many times in the past. The momentum is still strong and positive, so bulls can break higher and hit the next target seen at the level of 1.1908. In a case of a failure here, the nearest technical support is seen at the level of 1.1790 and it being tested by bears. Any violation of this support will lead to another leg down towards the level of 1.1724.
Weekly Pivot Points:
WR3 - 1.2004
WR2 - 1.1916
WR1 - 1.1875
Weekly Pivot - 1.1792
WS1 - 1.1756
WS2 - 1.1665
WS3 - 1.1629
Trading Recommendations:
Since the middle of March 2020 the main trend is on EUR/USD pair has been up, which can be confirmed by almost 10 weekly up candles on the weekly time frame chart and 4 monthly up candles on the monthly time frame chart. Nevertheless, weekly chart is recently showing some weakness in form of a several Pin Bar candlestick patterns at the recent top seen at the level of 1.2004. This means any corrections should be used to buy the dips until the key technical support is broken. The key long-term technical support is seen at the level of 1.1445. The key long-term technical resistance is seen at the level of 1.2555.

