GBP/USD 24H

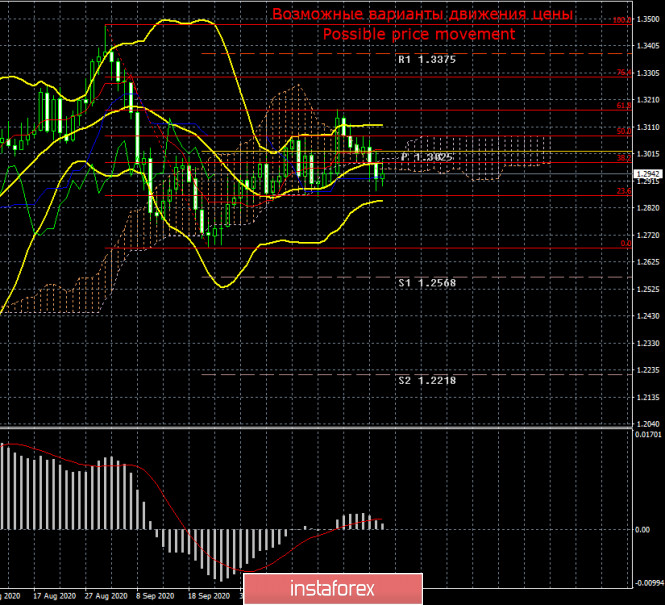
For the whole week, GBP/USD was trading lower like EUR/USD. Nevertheless, for GBP/USD the crucial move was a 61.8% fibo bounce. After this had happened, the odds for a further downtrend increased sharply. At the end of the week, GBP/USD slipped to the Kijun-sen line. If broken, the pair is likely to continue a further bearish trajectory. Thus, the US currency is winning favor with investors for the nearest weeks especially against the pound sterling. This scenario could be disrupted by the presidential election in the US and unexpected news on the talks between London and Brussels. From the technical viewpoint, the buyers could enter the market again if the price fails to fix below the critical level.
COT report

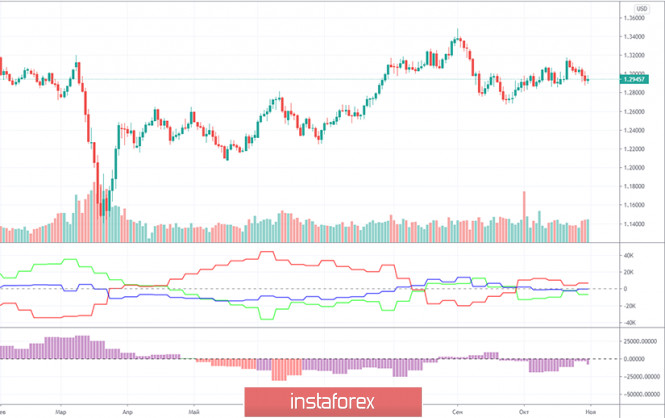
Over the week of October 20-26, GBP/USD surged nearly 70 pips. However, the pair reversed downwards in the following 4 days and plunged 90 pips. In essence, such losses are not so heavy, especially for the pound sterling. According to the latest COT report, non-commercial traders closed almost 8,300 buy-contracts and 3,400 sell-contracts. Thus, the market sentiment of the non-commercial group is turning more bearish because the net position decreased by nearly 5,000 contracts. During 3 previous weeks, traders were puzzled, trying to figure out whether it makes sense to sell EUR. The second indicator shows that sentiment of non-commercial traders was turning more bullish for three weeks in a row. However, on the reporting week traders resumed selling GBP. Please be aware that minus 5,000 of the net position is too much for the pound sterling. The overall number contracts opened by the non-commercial group equals 90,000. In this context, I expect a deeper fall of the pound sterling.
The fundamental background for GBP/USD can be described briefly: Brexit, the talks on the trade deal, and the presidential election in the US. This trading week, there has been no news on each of the issues. Last weekend, Brexit negotiators Michel Barnier and David Frost started a new round of the talks which should have been finished early this week. So, the talks were extended until Thursday. As a result, the parties have not unveiled any news. So, traders are at a loss about the ongoing developments and any progress. This is wrong to make any conclusions on the grounds of rumors. So, it would be better to wait for any official information from the negotiators or the UK and EU authorities. Meanwhile, they are keeping silence.
What information is available is the prospects of a new lockdown in the UK. British Premier Boris Johnson warned about it this week. Restrictive measures could come into force starting from November 4 for one month. According to surveys by Johns Hopkins University, the UK is dealing with rampant coronavirus rates. The UK reported almost 25,000 new daily cases over the last three days. So, the UK could be the third country like France and Germany to tighten restrictions. Earlier, Boris Johnson said that a new lockdown was out of the question because it would trigger a severe economic downturn. As we see, the Prime Minister promptly revised his viewpoint not for the first time. Well, a new lockdown will raise the likelihood of another nosedive in the British currency because this would entail another contraction of the national output. The UK GDP could have expanded 15.1% in Q3 2020, but the economy incurred heavier losses in Q2 2020. Experts say that the UK could enter the new 2021 year on the pessimistic note, extending losses in the wake of Brexit which would be officially over on December 31.
Trading plan for week of November 2-6
1)The buyers could lose any chance for the price to move upwards in the short term if the pair drops below the critical level. In case the price rebounds from the KIjun-sen line, the pair might resume the upward bias with a target at 1.3375. Meanwhile, there is a slim chance for a bounce. Moreover, don't forget about an important 61.8% fibo bounce.
2)The sellers still have more chances for developing the downtrend. They need to push the price down below the Kijun-sen line (1.2929) on the 24-hour time frame. In this case, there will be more chances for the price to go down with the first target at 1.2568. From the fundamental viewpoint, the sterling is set to extend weakness.
Notes for the pictures
The resistance/support levels are the target levels when opening long/short positions. You can place take profit levels next to them.
Indicators Ishimoku, Bollinger bands, MACD
Areas of support and resistance are the ones from where the price has rebounded or has been rejected a few times.
Indicator 1 in the COT charts is a size of net positions for each category of traders.
Indicator 2 in the COT charts is a size of net positions for the non-commercial group.
The material has been provided by InstaForex Company - www.instaforex.com