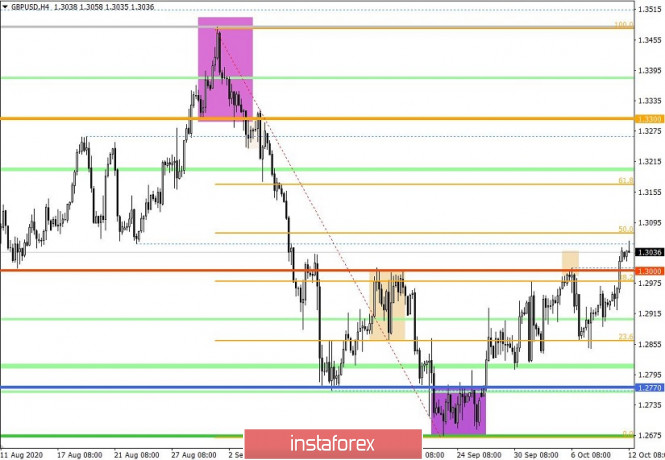
The GBP/USD pair managed to break through the psychological level of 1.3000 last week and consolidated above it for the first time since the beginning of September. The breakdown of the level and the update of the local high of the corrective move puts the downward tact set in the market on September 1 at risk, but if we take into account the fact that the recent price fluctuation is considered speculative, then everything can change quickly.
We have a global weakening of the US dollar which started during the American session. The sale of the dollar may be associated with the upcoming elections in the United States, but if we change the information field to the UK, we will see that the prospect of a weakening pound is higher in the long term than the dollar. But before the US election, speculators can turn the scheme of local surges in favor of the dollar's weakening.
Thus, knowing in advance that there is a high degree of coefficient of speculative positions, we should not make hasty conclusions about the change in the clock component 1.3480 ---> 1.2674.
Analyzing Friday's trading day by the fifteen-minute, the inertial upward movement of the price can be seen, which arose from 12:30 UTC+00 and lasted until the very close.
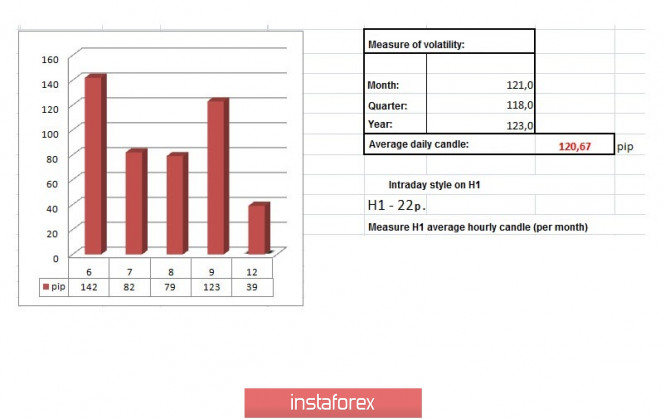
In terms of daily dynamics, 123 points were recorded for October 9, which is 2% higher than the average. The acceleration was expected given the two-day deceleration between October 7 and 8.
As discussed in the previous analytical review, the coordinates 1.2970, which is the local high on October 8 is important for traders, since its breakdown automatically provoked a flow of long positions, which happened as a result in the market.
Considering the trading chart in general terms (daily period), we can see a corrective move from the local low of 1.2674, where the recovery relative to the downward tact of September is 47% for the current day.
Friday's news background had weak statistics on the UK, which had practically no effect on the pound's rate. Statistics showed some improvement in dynamics, in particular, the rate of decline in industrial production slowed down from -7.4% to -6.4%, but the data still turned out to be much worse than forecasts. The recession was expected to slow down to -4.6%, especially since the industrial recession has lasted for 17 consecutive months.
In fact, this proves speculators' manipulation of the GBP/USD rate once again.
In terms of the information background, we have a telephone conversation between the two leaders: British Prime Minister Boris Johnson and German Chancellor Angela Merkel, where they talked about Brexit.
Johnson said that Britain was ready to take the hard way out and return to the WTO if the negotiations did not lead to anything.
On Monday, the Financial Times, citing EU diplomats, reported that the EU leaders intend to insist on tightening the provisions of the deal with the UK, primarily with regard to the mechanism for implementing the provisions of bilateral agreements during the EU summit in Brussels on October 15-16.
If we look above, we can notice that the Brexit situation is not very simple, and this will put pressure on the pound sterling.

In terms of the economic calendar, we do not have statistics in the UK and US today that are worthy of attention, thus, we should carefully observe the information flow, since this can trigger surges in the market.
Further development
Analyzing the current trading chart, the quote continues to be within the tolerance for deviation from the psychological level 1.2950/1.3050, which may affect the market in the form of stagnation. The main trading tactic, as before, will be local operations due to a high degree of speculative activity, where the information background can become the main motive for market changes. In terms of technical capabilities, it is worth looking at deviations from the psychological level, analyzing the price consolidating points beyond them.

Indicator analysis
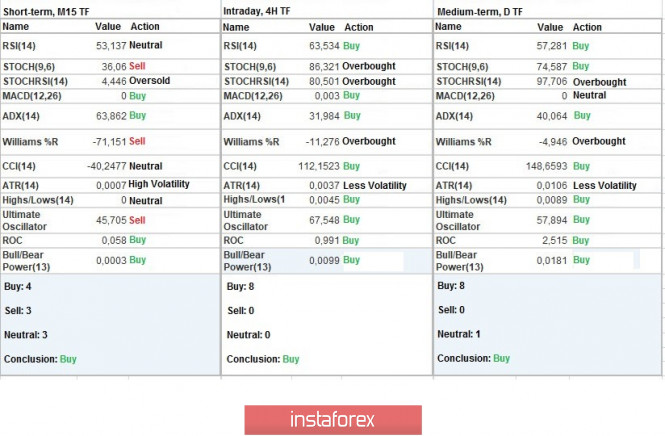
Analyzing different sectors of time frames (TF), we see that the indicators of technical instruments do not signal a buy, due to price fluctuations above the psychological level of 1.3000.

Weekly volatility / Volatility measurement: Month; Quarter; Year
Measurement of volatility reflects the average daily fluctuation, calculated per Month / Quarter / Year.
(It was built considering the publication time of the article)
The dynamics of the current time is 39 points, which is 67% below the average. We can say that such a low volatility will be temporary, and even in case of stagnation, we will see growth relative to the current level by 100-150%.

Key levels
Resistance zones: 1.3200; 1.3300 **; 1.3600; 1.3850; 1.4000 ***; 1.4350 **.
Support zones: 1.3000 ***; 1.2770 **; 1.2620; 1.2500; 1.2350 **; 1.2250; 1.2150 **; 1.2000 *** (1.1957); 1.1850; 1.1660; 1.1450 (1.1411).
* Periodic level
** Range level
*** Psychological level
The material has been provided by InstaForex Company - www.instaforex.com