GBP/USD 1H
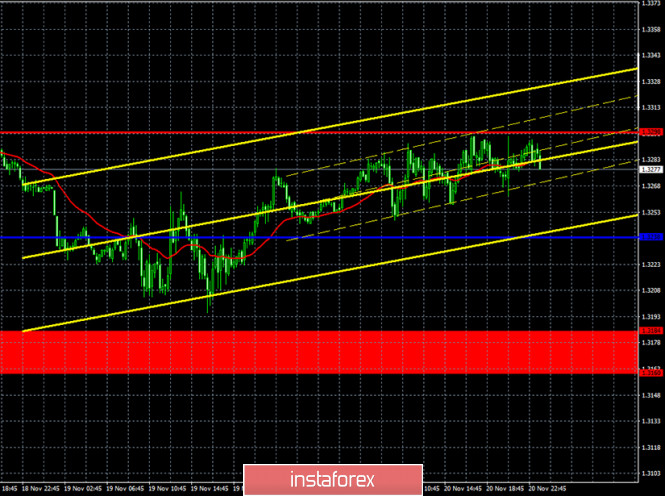
The GBP/USD pair continued a very weak upward movement on November 20 and by the end of the day, it had reached the resistance level of 1.3298 for the third time. The price could not overcome this level, so we are once again expecting, at least, a round of downward correction. In general, the technical picture for the pound/dollar pair is extremely confusing now. There are many technical factors that say the opposite. For example, the price settled below the upward trend line, but it went up and also failed to break through 1.3298 three times. Each rebound from the 1.3298 level leads to a smaller downward pullback than the previous one, which is an indirect sign that this level will not resist the onslaught of traders. Therefore, we would say that the technical picture still inclines us to the fact that the upward movement will continue. And then it contradicts the fundamental background, which has long been evidence that the pound should start falling.
GBP/USD 15M

Both linear regression channels are directed to the upside on the 15-minute timeframe, so there are no signs of ending the upward trend at this time. However, the pair cannot overcome the 1.3298 level in any way. The bulls' further prospects will depend on overcoming or not overcoming this level.
COT report

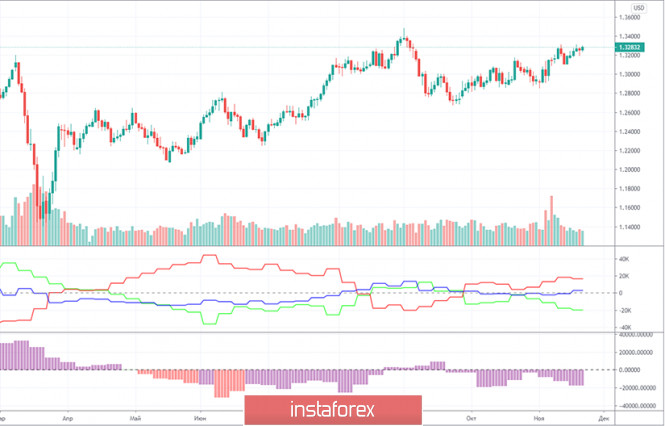
The GBP/USD pair rose by 25 points in the last reporting week (November 10-16), although the volatility was quite high during this time period. However, the Commitment of Traders (COT) report has not provided us with any important information that could help in forecasting and trading for several weeks now. Recall that the red and green lines must move away from each other or sharply change the direction of their movement, so that we can conclude that one trend ends and another begins. In recent months, both lines regularly change their direction, which indicates the absence of signals based on COT reports. What can we say about the most important group of non-commercial traders? This group opened 533 contracts to buy the pound and 616 contracts to sell during the reporting week. Therefore, it doesn't even make any special sense to calculate the change in the net position or the amount by which the attitude of professional traders has changed. A little more than 1000 contracts per week is very little. Therefore, in essence, there are no changes. What do we end up with? There are no changes, and the general picture of things does not make it possible to predict any definite development of the situation. So now it is better to pay more attention to technique and foundation.
The fundamentals for the British pound have not changed at all over the past week. As before, traders did not receive any important and significant news on the topic of trade negotiations. Although the European Commission recently made a statement that in the past few days, "there has been progress, after several weeks of virtually ineffectual results." This was stated by Ursula von der Leyen, but it is absolutely unclear whether this progress will allow the deal to be agreed upon in the end. Von der Leyen herself said that she could not name an approximate date when the deal could be fully agreed. At the same time, some publications report that there is still no mutual understanding on a number of basic issues, and these are all the same issues of fair competition and state support, fishing and a judicial issue. Therefore, it is not clear whether the parties were able to find a common language on the most important issues. London and Brussels could agree on 95% of all issues, but if these three key issues are not resolved, then there will be no deal.
The European Union and the United States will publish business activity indices in the services and manufacturing sectors on Monday, November 23. Business activity in the EU service sector should be reduced to 42.5 points. Take note that any reading below 50 is negative. If business activity falls, then this is definitely a bad call for the economy. It is quite possible that the British economy will begin to contract again due to the repeated lockdown in Great Britain. And this is an additional factor for the pound's decline. Thus, the pound continues to collect factors that should send it down by 300-500 points, but it continues to rise against the US dollar.
We have two trading ideas for November 23:
1) Buyers for the pound/dollar pair continue to hold the initiative in their hands. So we advise you to continue buying the pair while aiming for the resistance level of 1.3409 if the bulls manage to overcome the resistance level of 1.3298. Take Profit in this case will be up to 80 points.
2) Sellers are still out of work, nevertheless, they can join the game if the buyers fail to go beyond. If the price settles below the Kijun-Sen line, it will be possible to sell the pound/dollar pair while aiming for the support area of 1.3160 -1.3184 and the Senkou Span B line (1.3112). Take Profit in this case can range from 40 to 110 points.
Forecast and trading signals for EUR/USD
Explanations for illustrations:
Support and Resistance Levels are the levels that serve as targets when buying or selling the pair. You can place Take Profit near these levels.
Kijun-sen and Senkou Span B lines are lines of the Ichimoku indicator transferred to the hourly timeframe from the 4-hour one.
Support and resistance areas are areas from which the price has repeatedly rebounded off.
Yellow lines are trend lines, trend channels and any other technical patterns.
Indicator 1 on the COT charts is the size of the net position of each category of traders.
Indicator 2 on the COT charts is the size of the net position for the "non-commercial" group.
The material has been provided by InstaForex Company - www.instaforex.com