USD/JPY
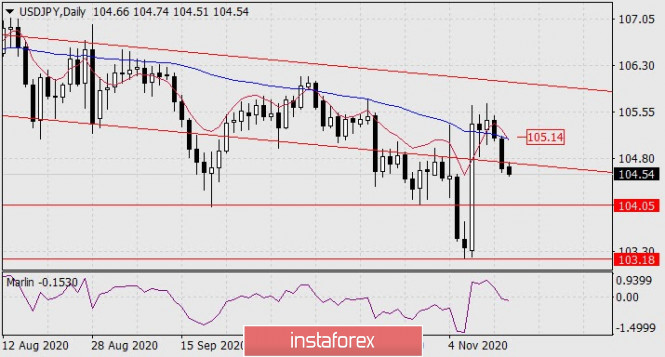
The USD/JPY pair fell by 48 points last Friday, breaking the support of the embedded price channel line (104.75) on the daily chart. The Marlin oscillator has penetrated the negative trend zone, the nearest target at 104.05 (October 29 low) is just ahead, followed by the second target of 103.18 – November 6 low.

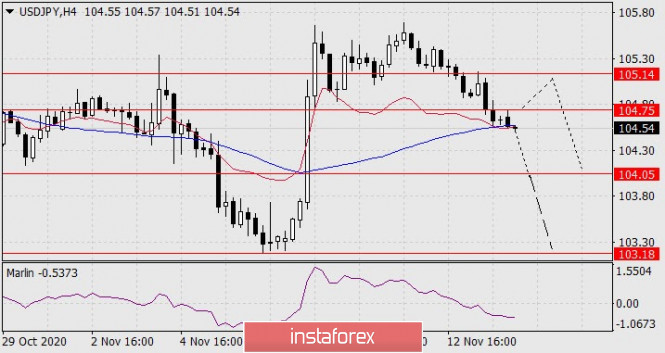
The price currently lies on two indicator lines on the four-hour chart – the MACD line and the balance line. In fact, the price is stuck between the daily price channel line (104.75) and the indicator lines.

This creates the probability that the price would go above the resistance, reaching the MACD line on the daily timeframe, near the 105.14 level. Subsequently, however, the price is most likely to fall with an attempt to take 104.05.
If a short-term reversal from the MACD line does not take place, the price will immediately go to the first goal. Depending on external circumstances, the price will either continue to fall to the second goal of 103.18, or will hesitate in correcting from the level of the first goal.
The material has been provided by InstaForex Company - www.instaforex.com