To open long positions on GBP/USD, you need:
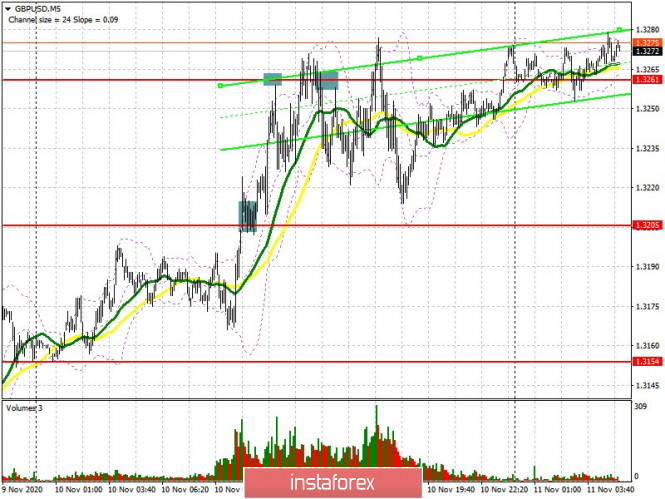
Contrary to all common sense, the British pound continues to grow against the US dollar, stamping entry signals to the market one by one. Let's take a look at the 5-minute chart and break down yesterday's trades. Everything is clear in the morning. Bulls break out and settle above resistance at 1.3205, where I recommended opening long positions. As a result, the pound gained more than 50 points and reached the 1.3261 target. I recommended selling the pound from the 1.3261 level immediately on a rebound with a correction of 20-30 points. In the end, this is what happened. After testing 1.3161, the pound rebounded by around 33 points.The bulls tried to go above 1.3261, but the bears managed to form a false breakout and pushed the pair to the 1.3205 area (the entry point after the false breakout is marked on the chart).

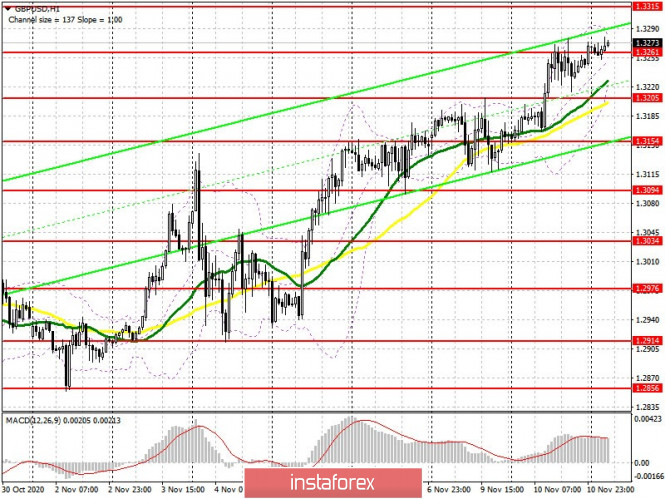
But as we can see now, buyers of the pound do not intend to give up, and they have already taken resistance at 1.3261 in the Asian session, without encountering much opposition from the bears. Entry points to long positions are very difficult right now. One thing is clear, as long as trading continues above 1.3261, you can open long positions while expecting GBP/USD to strengthen to a high of 1.3315. Resistance at 1.3378 will be the next target, which is where I recommend taking profits. If bears try to regain control over the 1.3261 level and it fails while pound buyers form a false breakout there in the first half of the day, this will be an additional signal to open long positions. If bulls are not active when GBP/USD falls to support at 1.3261, then it is best not to rush into buying, but to wait until a larger area at around 1.3205 has been updated. I recommend opening long positions immediately on a rebound from a low of 1.3154, counting on a correction of 20-30 points within the day.
To open short positions on GBP/USD, you need:
Sellers need to get back to the 1.3261 level, which they missed today in the Asian session. Testing this area from the bottom up will be the first signal to open short positions in anticipation of a downward correction to the support area of 1.3205, where I recommend taking profits. Moving averages, playing on the buyer's side, are just below this level. An equally important task for sellers is to break and settle below support at 1.3205, which will quickly pull down GBP/USD to a low of 1.3154, where I recommend taking profits. Since we do not have any important fundamental statistics on the British economy today, there is a chance that the pair could grow. Lack of bears' activity in the resistance area of 1.3261 will result in strengthening GBP/USD. Therefore, while trading is above 1.3261, I recommend postponing short positions until the 1.3315 high is renewed. Selling the pound right away on a rebound is best done from a larger resistance of 1.3378, counting on a correction of 20-30 points.

The Commitment of Traders (COT) report for November 3 showed a reduction in long positions and a slight increase in short ones. Long non-commercial positions fell from 31,799 to 27,701. At the same time, short non-profit positions only rose to 38,928, from 38,459. As a result, the negative non-commercial net position was 11,227, against 6,660 a week earlier, which indicates that sellers of the British pound remain in control and have a minimal advantage in the current situation.
Indicator signals:
Moving averages
Trading is carried out above 30 and 50 moving averages, which indicates further growth along the trend.
Note: The period and prices of moving averages are considered by the author on the H1 hourly chart and differs from the general definition of the classic daily moving averages on the daily D1 chart.
Bollinger Bands
A breakout of the upper border in the 1.3270 area will lead to a new wave of growth for the pound. A break of the lower border of the indicator around 1.3215 will increase the pressure on the pound.
Description of indicators
- Moving average (moving average, determines the current trend by smoothing out volatility and noise). Period 50. It is marked in yellow on the chart.
- Moving average (moving average, determines the current trend by smoothing out volatility and noise). Period 30. It is marked in green on the chart.
- MACD indicator (Moving Average Convergence/Divergence — convergence/divergence of moving averages) Quick EMA period 12. Slow EMA period to 26. SMA period 9
- Bollinger Bands (Bollinger Bands). Period 20
- Non-commercial speculative traders, such as individual traders, hedge funds, and large institutions that use the futures market for speculative purposes and meet certain requirements.
- Long non-commercial positions represent the total long open position of non-commercial traders.
- Short non-commercial positions represent the total short open position of non-commercial traders.
- Total non-commercial net position is the difference between short and long positions of non-commercial traders.
