To open long positions on GBP/USD, you need:
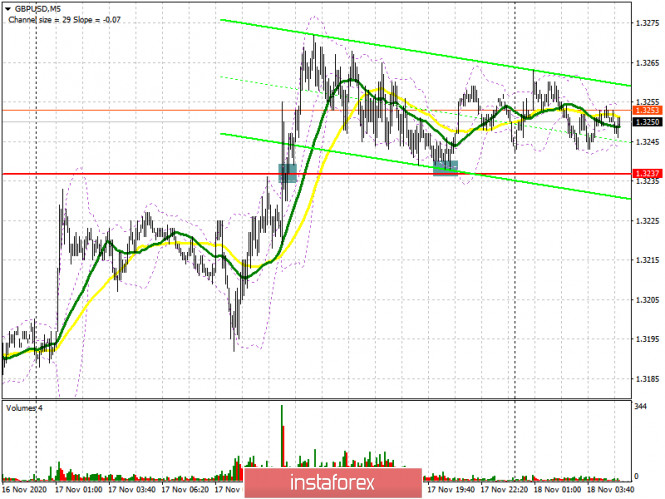
In yesterday's afternoon forecast, I drew attention to the breakout and being able to settle above the resistance of 1.3237, but, unfortunately, by that time I could not anticipate a convenient entry point to long positions. I also mentioned that one should wait until the 1.3237 level has been tested from top to bottom and only then enter long positions, which happened. If you look at the 5-minute chart, you will see how the bears are returning GBP/USD to the support area of 1.3237, afterwards a new wave of growth appeared. However, the lack of progress in the Brexit trade talks is holding back consumer demand.

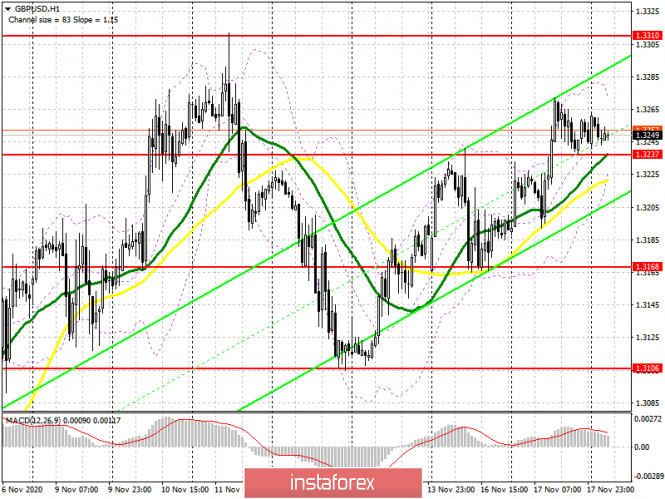
From a technical point of view, nothing has changed. I recommend opening long positions only if the bulls keep 1.3237, or form a false breakout, in order to sustain the upward trend. This may happen immediately after the UK inflation report has been released. If the report matches the economists' forecasts or turns out to be better than forecasts, then the bulls will continue to buy the pound. In this case, the buyers' nearest target will be this month's high at 1.3310, where the upward movement will initially stop. Only a breakthrough and being able to settle above this range will produce a new wave of growth for the pound, and an exit in the areas of 1.3378 and 1.3467, which is where I recommend taking profits. If the data turns out to be worse than economists' forecasts, and inflation decelerates more than expected, then GBP/USD will quickly return below the 1.3237 level. In this scenario, it is best to postpone long positions until the 1.3168 low has been updated, or to buy the pair immediately on a rebound from the larger area of 1.3106, which is a kind of lower border of the wide horizontal channel of 1.3106-1.3310 in which the pound has been in for the whole month.
To open short positions on GBP/USD, you need:
The bears will continue to struggle in regaining control over the 1.3237 level, which they managed to miss yesterday morning amid the lack of fundamental statistics and news on Brexit. Today's inflation report may become a determining factor for the pound's succeeding direction in the short term. Weak data will provide an opportunity for bears to return GBP/USD below the 1.3237 level. Testing it from the bottom up produces a good enough entry point for short positions, which can pull down the pound to the 1.3168 low, where I recommend taking profits. Only a breakout of 1.3168 and being able to settle below this range will give sellers more confidence, which will open a straight path to the lows of 1.3106 and 1.3034. In case sellers are not active and we receive good UK inflation data, then it is best to postpone short positions until the 1.3310 highs are renewed, provided that a false breakout is formed there. I recommend selling GBP/USD immediately on a rebound from a high of 1.3378, counting on a correction of 20-30 points within the day.

The Commitment of Traders (COT) report for November 10 showed a slight increase in long positions and a sharp inflow of short positions. Long non-commercial positions rose from 27,701 to 27,872. At the same time, short non-commercial positions increased from 38,928 to 45,567. As a result, the negative non-commercial net position was -17,695, against -11,227 weeks earlier, which indicates that the sellers of the British pound retains control and also shows their minimal advantage in the current situation.
Indicator signals:
Moving averages
Trading is carried out just above the 30 and 50 moving averages, which indicates the likelihood of continued bullish momentum.
Note: The period and prices of moving averages are considered by the author on the H1 hourly chart and differs from the general definition of the classic daily moving averages on the daily D1 chart.
Bollinger Bands
A breakout of the upper border of the indicator around 1.3275 will lead to a new wave of growth for the pound. A breakout of the lower border at 1.3237 will increase pressure on the pair.
Description of indicators
- Moving average (moving average, determines the current trend by smoothing out volatility and noise). Period 50. It is marked in yellow on the chart.
- Moving average (moving average, determines the current trend by smoothing out volatility and noise). Period 30. It is marked in green on the chart.
- MACD indicator (Moving Average Convergence/Divergence — convergence/divergence of moving averages) Quick EMA period 12. Slow EMA period to 26. SMA period 9
- Bollinger Bands (Bollinger Bands). Period 20
- Non-commercial speculative traders, such as individual traders, hedge funds, and large institutions that use the futures market for speculative purposes and meet certain requirements.
- Long non-commercial positions represent the total long open position of non-commercial traders.
- Short non-commercial positions represent the total short open position of non-commercial traders.
- Total non-commercial net position is the difference between short and long positions of non-commercial traders.
