EUR/USD 1H

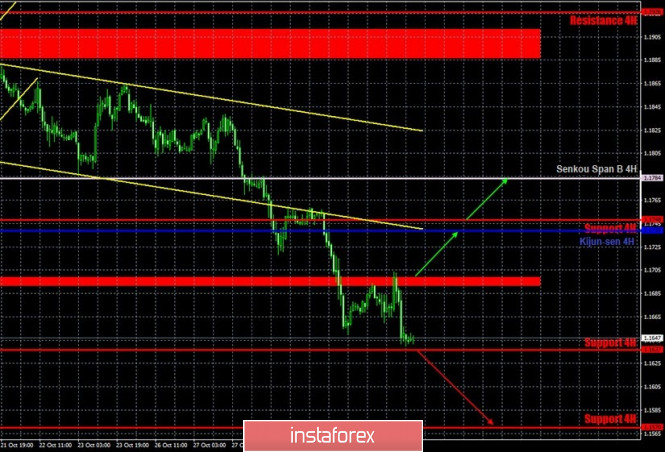
The EUR/USD pair tried to start a more or less tangible correction on the hourly timeframe on October 30, but failed to do so. Buyers failed to take the pair above the resistance area of 1.1691-1.1698. The pair rebounded off this area and the bears got down to business again. As a result, the pair dropped to the support level of 1.1637 by the end of the day. The price is far from the descending channel, so it can no longer be considered relevant. There are no new channels or trend lines at this time. Therefore, when making trading decisions, you can only rely on rebounds/overcoming from one or another resistance/support. By the way, the price failed to quickly return to the 1.1700-1.1900 area, so it is quite possible that a new downward trend will actually begin now.
EUR/USD 15M

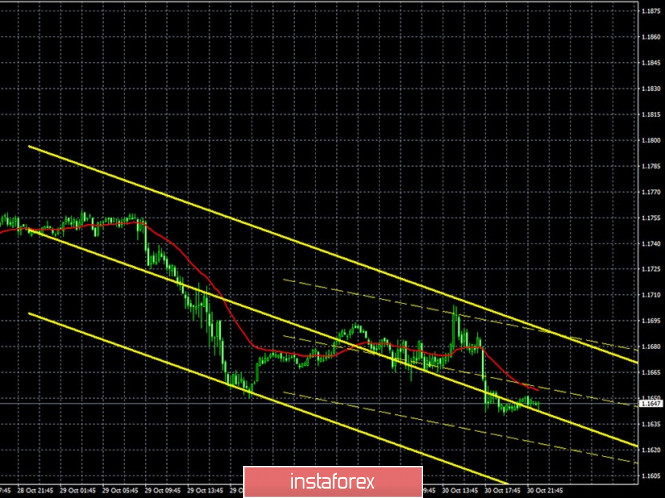
Both linear regression channels are directed to the downside on the 15-minute timeframe, which eloquently indicates the current trend on the hourly chart and indicates that there are no signs of a noticeable upward correction.
COT report

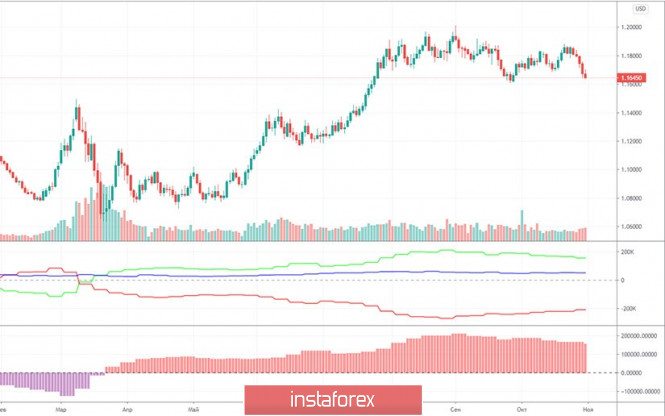
The EUR/USD pair rose quite a bit during the last reporting week (October 20-26). Therefore, we can conclude that professional market participants did not make any extremely large purchases and sales of the European currency. However, the new Commitment of Traders (COT) report showed that non-commercial traders were actively closing Buy-contracts (longs) during the reporting week. In total, 12,000 of them were closed. But professional traders were in no hurry to get rid of Sell-contracts (shorts), having closed only 1,000. Thus, the net position of this group of traders decreased by 11,000 contracts at once. It is possible that the main closing of the Buy-contracts took place at the end of the reporting week, because in the following days a more tangible drop in euro's quotes began. Within its framework, the euro/dollar pair lost about 160 points. We remind you that if the net position decreases, it means that the traders' sentiment becomes more bearish. Thus, so far, our forecast is coming true. In the analysis of previous COT reports, we said that the high around the 1.2000 level could remain as the peak for the entire upward trend. The first indicator and its green line clearly show that non-commercial traders have been cutting back on long deals on the euro for two months now. And non-commercial traders are the most important group of large traders in the foreign exchange market. It is believed that it is the one responsible for driving the market.
There were a lot of macroeconomic publications on Friday, October 30. It all started in Germany, where the GDP for the third quarter was published in the first estimate. It turned out that the growth of the indicator in quarterly terms was 8.2%. We think this is quite small. For example, the increase was 16.1% in Italy, and 16.7% in Spain. It is another matter that all these numbers are not of particular importance now, since the second wave of COVID-2019 continues to gain momentum in the European Union, and the German economy has already entered the second lockdown. Quarantine measures are tightening in all European countries, so at the end of the year, we can again expect a reduction in GDP. The European Union also published its GDP indicator, which increased by 12.7%, offsetting almost all losses of the second quarter. However, traders were more impressed by the words of European Central Bank President Christine Lagarde, who made a very pessimistic statement about the prospects for the European economy a day earlier, so they did not appreciate the recovery of the EU economies. After all these data, the inflation rate did not matter much for the markets.
We have two trading ideas for November 2:
1) The EUR/USD pair resumed its downward movement. Thus, buyers are encouraged to wait for more favorable conditions to open a position. For example, when the price settles above the 1.1691-1.1698 area. In this case, you can open small longs while aiming for the Kijun-sen line (1.1739) and the Senkou Span B line (1.1784). Take Profit in this case can be up to 70 points.
2) Bears are active, but gradually, pull down the pair. Thus, sellers are advised to continue to trade down while aiming for the support level of 1.1570, if the price settles below the 1.1637 level. A price rebound from any target can trigger a round of corrective movement. Take Profit in this case can be up to 50 points, which is not so little, given the current volatility levels.
Hot forecast and trading signals for GBP/USD
Explanations for illustrations:
Support and Resistance Levels are the levels that serve as targets when buying or selling the pair. You can place Take Profit near these levels.
Kijun-sen and Senkou Span B lines are lines of the Ichimoku indicator transferred to the hourly timeframe from the 4-hour one.
Support and resistance areas are areas from which the price has repeatedly rebounded off.
Yellow lines are trend lines, trend channels and any other technical patterns.
Indicator 1 on the COT charts is the size of the net position of each category of traders.
Indicator 2 on the COT charts is the size of the net position for the "non-commercial" group.
The material has been provided by InstaForex Company - www.instaforex.com