EUR/USD 1H

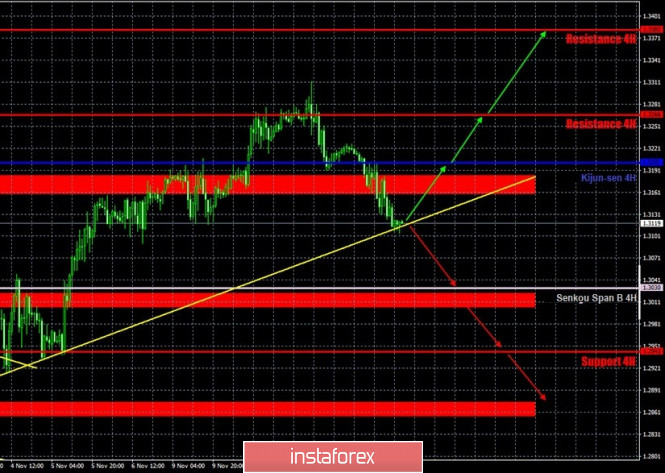
The EUR/USD pair failed to continue moving down and began to correct on the hourly timeframe on Thursday, November 12. On the other hand, this upward movement can be the initial stage of bringing back the upward trend. If we consider the movement from November 4 as an upward trend, and the movement from November 9 as a correction within it, then it is quite possible to bring back the upward movement. However, since we still have neither a trend line nor a trend channel at our disposal, this hypothesis still remains without technical confirmation. And so traders still have to rely only on important lines and levels. For example, now the price is between the Senkou Span B and Kijun-sen lines. Both lines are important in the framework of the Ichimoku indicator. For example, getting the price to settle above the Kijun-sen will be a strong signal to bring back the upward trend. And vice versa. Overcoming the Senkou Span B line will be a strong signal to continue the new downward trend from November 9. At the same time, take note that the price continues to move within the horizontal channel at 1.1700-1.1900, which is where it was in for the last three months. Therefore, a flat is generally preserved in the longer term than the hourly timeframe.
EUR/USD 15M

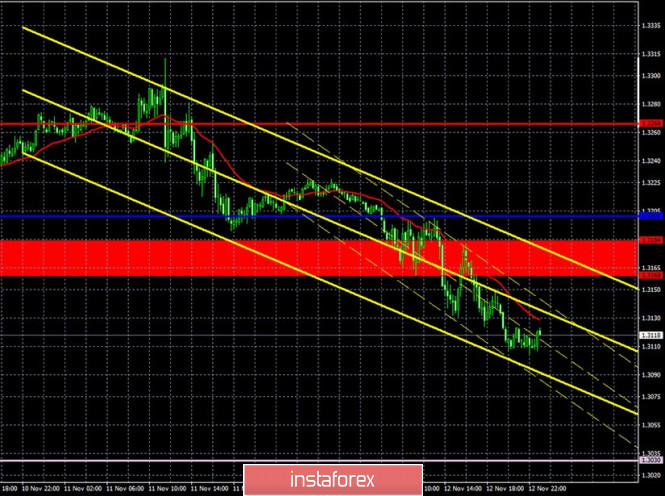
The linear regression channels moved up on the 15-minute timeframe. Therefore, we have some reason to believe that the upward trend will resume. At the same time, if traders fail to overcome the Kijun-sen line or manage to overcome the Senkou Span B line, the picture may change to the opposite. We would say that the pair's future movement depends on these two lines.
COT report

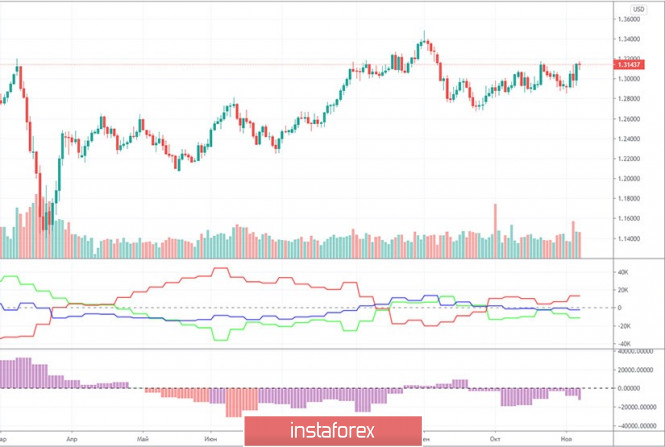
The EUR/USD pair lost 170 points during the last reporting week (October 27-November 2). A strong upward movement began after this time range. Therefore, the fact that the pair gained 220 points simply does not fall within the timeframe of the latest Commitment of Traders (COT) report. According to it, professional traders closed 9,200 Buy-contracts (longs) and opened 7,800 Sell-contracts (shorts). Thus, the net position for non-commercial traders decreased by 17,000 at once. And any decrease in the net position indicates a strengthening of the bearish mood. Consequently, professional traders continue to look towards selling the euro. Therefore, even despite the subsequent growth, we still believe that the high near the 1.2000 level will still be the peak of the entire upward trend. At least the COT data continues to signal just that. The technical analysis may contradict the COT report, as the latter comes out with a three-day delay. We cannot now know how the big players behaved in the period from November 3 to 6, which is when the dollar was significantly falling due to the elections. Indicators are also signaling good prospects for a new downward trend, as the green and red lines continue to narrow (the first indicator). And they, we recall, reflect the net positions of non-commercial traders and commercial ones.
There were quite important macroeconomic reports on Thursday. For example, inflation in Germany remains at a negative level, which is in fact a deflation. And given the lockdown in Germany and many other EU countries, it is unlikely that it will accelerate any time soon. Consequently, the general European inflation is unlikely to show positive dynamics in the coming months. Industrial production in the EU was also disappointing, reaching 6.8% y/y and -0.4% m/m. Traders were counting on higher values. However, the euro strengthened during the day. That's because US reports weren't much better either. The US CPI started to slow down after strong performance in recent months, so the dollar didn't have much to be happy about either. The report on unemployment claims was also released, which were slightly better than expected. However, it no longer aroused any emotions among traders.
A report on Germany's GDP for the third quarter will be released today. A similar figure will be published for the EU as a whole. However, these are the second estimates of these indicators, which means traders are already absolutely ready for the predicted values, since they were published a month ago. Consequently, if there are no major changes in comparison with the first estimate, then traders might not react. The University of Michigan Consumer Confidence Index will be released today, which is also unlikely to cause a strong market reaction.
We have two trading ideas for November 13:
1) Buyers kept the pair above the Senkou Span B line (1.1760), which means they have a good chance of seizing the initiative. If the price settles above the Kijun-sen line (1.1833), then you are advised to open long positions while aiming for the resistance area of 1.1886-1.1912 and the resistance level 1.1976. Take Profit in this case will be from 30 to 120 points.
2) Bears started their trend, however, they came across a serious obstacle near the Senkou Span B line (1.1760). Thus, in order to be able to resume trading downward while aiming for the support area of 1.1692-1.1699 and 1.1612-1.1624, you need to wait for this line to be overcome. Take Profit in this case can range from 40 to 120 points.
Hot forecast and trading signals for GBP/USD
Explanations for illustrations:
Support and Resistance Levels are the levels that serve as targets when buying or selling the pair. You can place Take Profit near these levels.
Kijun-sen and Senkou Span B lines are lines of the Ichimoku indicator transferred to the hourly timeframe from the 4-hour one.
Support and resistance areas are areas from which the price has repeatedly rebounded off.
Yellow lines are trend lines, trend channels and any other technical patterns.
Indicator 1 on the COT charts is the size of the net position of each category of traders.
Indicator 2 on the COT charts is the size of the net position for the "non-commercial" group.
The material has been provided by InstaForex Company - www.instaforex.com