GBP/USD 1H

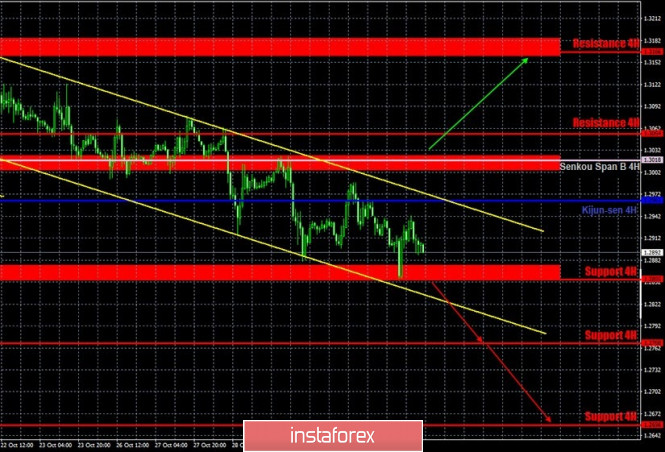
The GBP/USD pair reached the support area of 1.2854-1.2873 on Monday, November 2 and failed to overcome it on the first attempt. In general, trading was rather calm on the first trading day of the week. The rebound was followed by a systematic increase in quotes, all within the descending channel. Thus, the trend for the pound/dollar pair remains downward at this time, and the bears continue to hold the initiative in their hands. As for the bulls, they now need to leave the channel through its upper border, as well as overcome the important Senkou Span B and Kijun-sen lines. An upward movement will mean a strengthening of the British currency, which will be possible if positive information comes from London on the progress of negotiations on the deal.
GBP/USD 15M

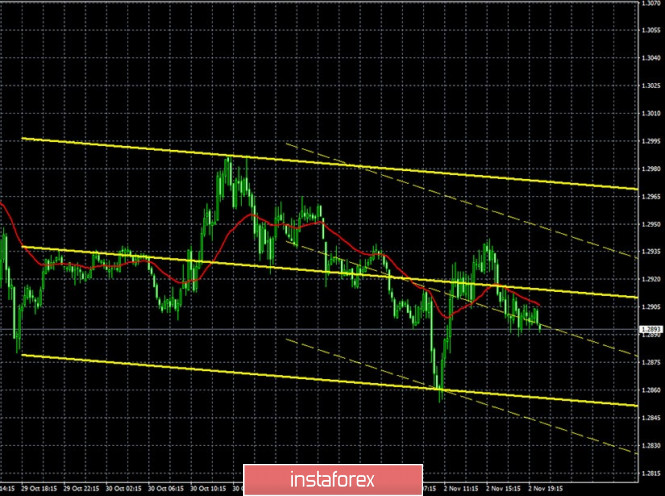
Both linear regression channels turned to the downside on the 15-minute timeframe, which indicates a continuation of the downward movement on the hourly chart. However, the pair was not allowed to go down the 1.2854-1.2873 area, so the correction may continue for some time.
COT report

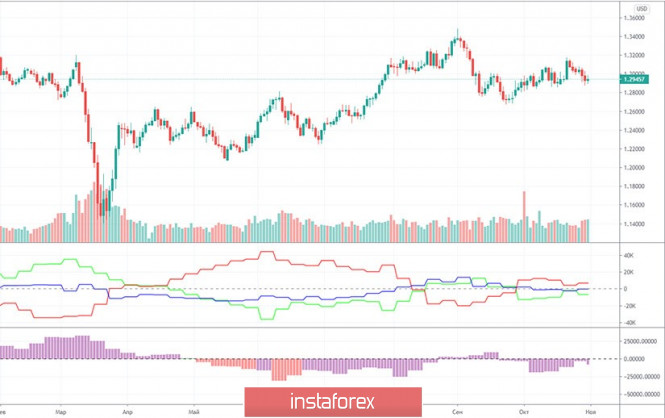
The latest Commitments of Traders (COT) report on the British pound showed that non-commercial traders were quite active in the period from October 20-26. However, their sentiment changed again, as can be seen from the green line of the first indicator in the chart. The mood of the "non-commercial" group of traders became more bullish for three consecutive weeks, but the net position decreased by 5,000 contracts over the last reporting week, so we can conclude that professional traders are again inclined to sell off the pound. However, if you look at the COT reports over the past few weeks or look at the first indicator, it becomes clear that commercial and non-commercial traders do not have a clear trading strategy right now. Perhaps this is due to an extremely unstable and complex fundamental background. The fact remains. The pound lost 90 points in recent trading days, and we believe that it will continue to fall. However, in the near future, we might receive important information about the progress of negotiations on the UK-EU trade deal, and the results of the vote for the US president will also become known. This information can change the mindset of professional traders. You need to be prepared for this.
Fundamental background for GBP/USD remained unchanged on Monday. There is still no VERIFIED information on the progress of negotiations between the groups of Michel Barnier and David Frost. The US presidential elections will continue today, and no clear information about that yet. The UK published an index of business activity in the manufacturing sector, which, like European indices, turned out to be higher than forecasts and the value of September. However, the pound failed to extract special dividends from this. Markets are fully focused on more important fundamental topics, so they do not pay any attention to secondary macroeconomic publications. The US also released manufacturing PMIs, which also turned out to be higher than expected. The ISM index was 59.3 and the Markit index was 53.4. There are no major publications or other events scheduled in America and Britain other than the US presidential election on Tuesday. Thus, all the attention is paid to the American media, which will keep us informed of the voting progress.
We have two trading ideas for November 3:
1) Buyers for the pound/dollar pair failed to settle above the Kijun-Sen line. Thus, the initiative remains in the hands of the bears, and long positions, accordingly, are irrelevant. You can consider long deals again if the price settles above the Senkou Span B (1.3018) and Kijun-sen (1.2963) lines while aiming for the resistance area of 1.3160 - 1.3184. Take Profit in this case will be up to 110 points.
2) Sellers continue to pull down the pair, but yesterday they could not overcome the support area of 1.2855-1.2874. Therefore, you can consider new sell positions while aiming for 1.2855-1.2874 in case the price rebounds from the Kijun-sen line (1.2963). If this area is overcome, you are also advised to trade down while aiming for the support level of 1.2768. Take Profit in the first case will be up to 80 points, in the second - up to 70.
Hot forecast and trading signals for EUR/USD
Explanations for illustrations:
Support and Resistance Levels are the levels that serve as targets when buying or selling the pair. You can place Take Profit near these levels.
Kijun-sen and Senkou Span B lines are lines of the Ichimoku indicator transferred to the hourly timeframe from the 4-hour one.
Support and resistance areas are areas from which the price has repeatedly rebounded off.
Yellow lines are trend lines, trend channels and any other technical patterns.
Indicator 1 on the COT charts is the size of the net position of each category of traders.
Indicator 2 on the COT charts is the size of the net position for the "non-commercial" group.
The material has been provided by InstaForex Company - www.instaforex.com