GBP/USD 1H

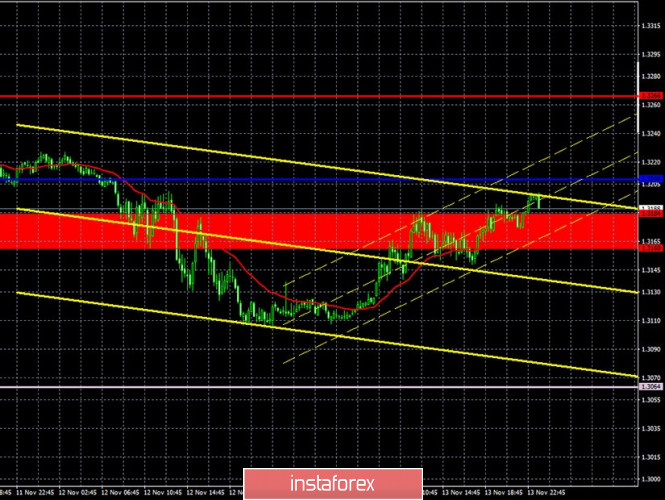
The GBP/USD pair failed to overcome the upward trend line on Friday, November 13 and rebounded off it, thus maintaining the upward trend. The bulls managed to keep the initiative in their hands, which means that the absolutely illogical, from a fundamental point of view, upward movement may continue for some time. The nearest barrier from above is the Kijun-sen line. If buyers manage to pass then the upward movement will remain present. At the same time, take note of the fact that the British pound's current positions are extremely high and practically unfounded. Therefore, we are still waiting for a downward movement. The price could not move far from the trend line on Friday, so it is absolutely possible to test this line. And on the second attempt, the price can still overcome it. Only the news of the signing of a trade agreement between the UK and the European Union can prolong the sweet life of the pound. However, so far there are no prerequisites for this.
GBP/USD 15M

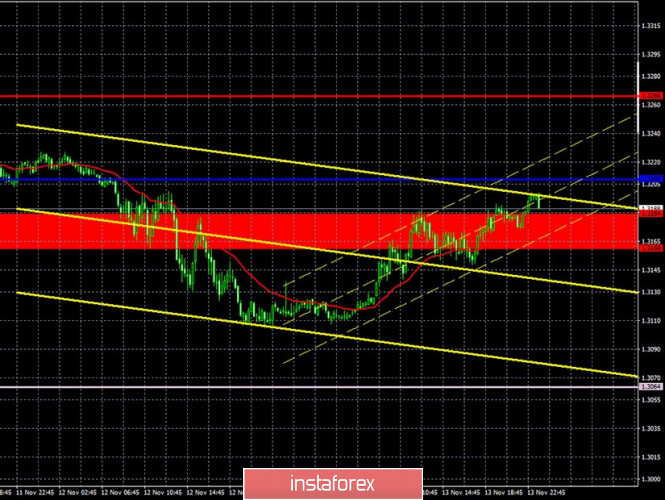
The lower linear regression channel turned to the upside on the 15-minute timeframe, so there are signs of bringing back the upward movement on the hourly timeframe. In the next couple of days, buyers need to keep the pair above the trend line and it is desirable to overcome the critical Kijun-sen line, as the bears will make new attempts to form a new downward trend.
COT report

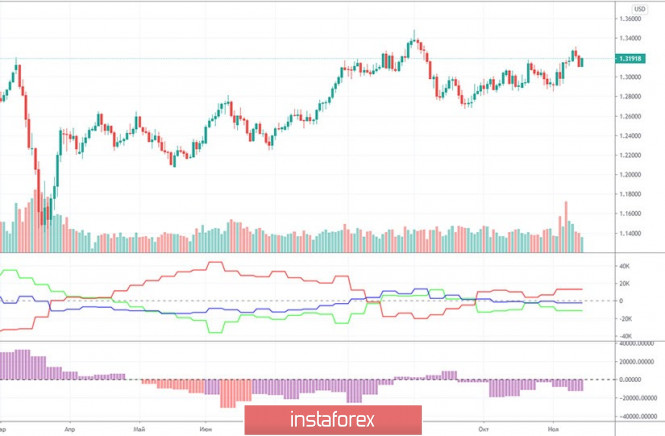
The GBP/USD pair increased by 250 points in the last reporting week (November 3-9). It is not surprising that the pound strengthened, since the US presidential election was held during this period, and the dollar was declining against its main competitors. However, the pound began to grow after this period. In general, the pound has been growing recently. But the Commitment of Traders (COT) reports does not really provide any useful information. Non-commercial traders closed 3,300 Buy-contracts (longs) and opened 1,100 Sell-contracts (shorts). Therefore, they became more bearish, and the net position decreased by 4,400, which is not so small for the pound. Recall that the "non-commercial" group opened a total number of 87,000 contracts. Thus, 4,400 is 5%. As for the general trend among professional traders, the indicators in the chart clearly show that there is no trend at this time. The green line (net position of non-commercial traders) on the first indicator constantly changes its direction. The second indicator also shows the absence of a trend, as professional traders increase the net position, then reduce it. Thus, no long-term conclusions or forecasts can still be made based on the COT report. We recommend paying more attention to technique and foundation.
The fundamental background for the British pound was completely empty last Friday. No important news on that day. Therefore, traders simply had nothing to react to. There is still no information on the topic of the British-European talks. And even the topic of the US presidential election is slowly receding into the second or third plan. Donald Trump has not done anything that he promised to do. He still does not recognize Joe Biden's victory in the election (meaning a fair victory) and continues to insist that the Democrats rigged the election. However, no evidence has been provided for public viewing. Just like charges against China, impeachment charges, and many other cases. Also, Trump recently promised to provide new information from the intelligence services regarding fraud, but this has also not been done so far. Thus, there will most likely be no high-profile legal proceedings. The Trump team has filed numerous lawsuits, but it is not enough to just review the results in just one or two states. In general, Trump lost and now the only concern is whether he will hand over the reins of government of the country in a peaceful way and without a new war with the Democrats or not.
No major events in the UK scheduled for Monday. Therefore, the volatility of the pound/dollar pair may remain quite weak. However, market participants will continue to wait for information from the Brexit negotiations, which are ongoing in London. However, there is little hope that positive information will be received on Monday. However, the next round of negotiations will end sooner or later, so we can only wait.
We have two trading ideas for November 16:
1) Buyers for the pound/dollar pair kept the initiative in their hands. Thus, we recommend buying the pair while aiming for the resistance levels of 1.3266 and 1.3382, if the bulls also manage to overcome the critical line of the Kijun-sen (1.3208). Take Profit in this case will be from 40 to 160 points.
2) Sellers could not pull down the pair below the trend line, so they are still out of work. If the price settles below the trend line, the trend will change to a downward trend and you can sell the pound/dollar pair while aiming for the Senkou Span B line (1.3064) and the support area of 1.3004-1.3024. Take Profit in this case can range from 60 to 100 points.
Hot forecast and trading signals for EUR/USD
Explanations for illustrations:
Support and Resistance Levels are the levels that serve as targets when buying or selling the pair. You can place Take Profit near these levels.
Kijun-sen and Senkou Span B lines are lines of the Ichimoku indicator transferred to the hourly timeframe from the 4-hour one.
Support and resistance areas are areas from which the price has repeatedly rebounded off.
Yellow lines are trend lines, trend channels and any other technical patterns.
Indicator 1 on the COT charts is the size of the net position of each category of traders.
Indicator 2 on the COT charts is the size of the net position for the "non-commercial" group.
The material has been provided by InstaForex Company - www.instaforex.com