EUR/USD 1H

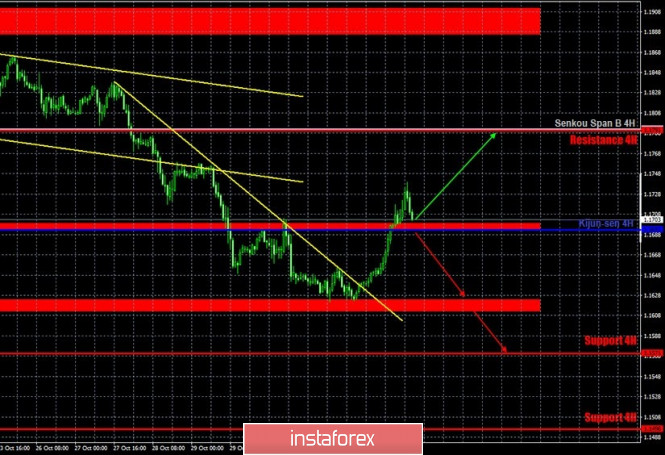
The EUR/USD pair traded quite volatile, but was also calm on the hourly timeframe on Tuesday, November 3. No sharp turns, changes in direction of movement and an outright storm with swings during the day. The pair ideally, from a technical point of view, reached the support area of 1.1612-1.1624 twice, rebounded off it and started a strong upward movement. The downward trend line was also broken, so there were plenty of signals to move up. Also, during its upward movement, the quotes of the pair crossed the critical Kijun-sen line, so the likelihood of a further growth in the pair increased even more. At the same time, the situation may change to a more turbulent one today, since the US elections will come to an end and the voting results will begin to be slowly summed up.
EUR/USD 15M

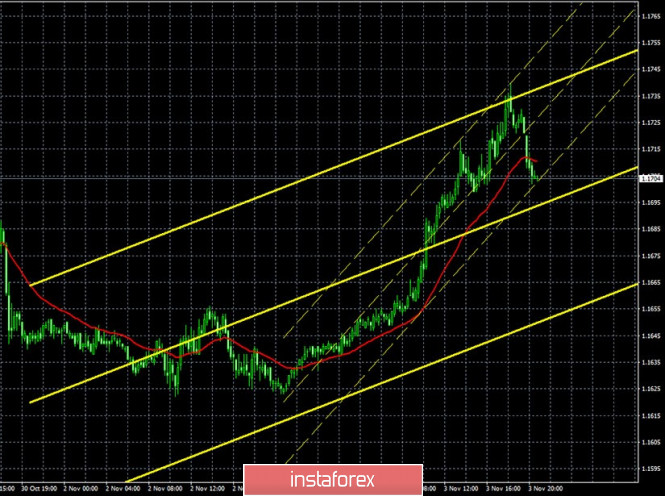
Both linear regression channels turned to the upside on the 15-minute timeframe, which accurately reflected the trend of the hourly chart, where an upward movement began after rebounding from the 1.1612-1.1624 area.
COT report

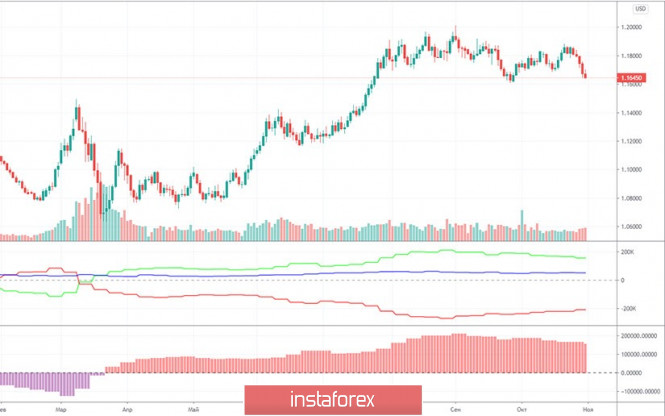
The EUR/USD pair rose quite a bit during the last reporting week (October 20-26). Therefore, we can conclude that professional market participants did not make any extremely large purchases and sales of the European currency. However, the new Commitment of Traders (COT) report showed that non-commercial traders were actively closing Buy-contracts (longs) during the reporting week. In total, 12,000 of them were closed. But professional traders were in no hurry to get rid of Sell-contracts (shorts), having closed only 1,000. Thus, the net position of this group of traders decreased by 11,000 contracts at once. It is possible that the main closing of the Buy-contracts took place at the end of the reporting week, because in the following days a more tangible drop in euro's quotes began. Within its framework, the euro/dollar pair lost about 160 points. We remind you that if the net position decreases, it means that the traders' sentiment becomes more bearish. Thus, so far, our forecast is coming true. In the analysis of previous COT reports, we said that the high around the 1.2000 level could remain as the peak for the entire upward trend. The first indicator and its green line clearly show that non-commercial traders have been cutting back on long deals on the euro for two months now. And non-commercial traders are the most important group of large traders in the foreign exchange market. It is believed that it is the one responsible for driving the market.
The presidential elections began in the United States on Tuesday. To be more precise, they began a few weeks ago, and by November 3, about 100 million people had already voted in America. A record turnout over the past 100 years for sure. However, despite the fact that polling stations will close in the United States literally within a few hours, this does not mean that we will find out the name of the new US President this morning. The vote count is likely to take anywhere from a few days to several weeks, as many Americans have chosen to vote safely this year by mail. Therefore, in the coming days, and maybe weeks, the markets will again be filled with rumors as to who won the election. In addition, the indexes of business activity in the service sectors will be released today, similar data will be released overseas. The most important report of the day is the ADP report on changes in the level of employment in the US private sector, however, it is unlikely for traders to focus on it. We will miss more important news today.
We have two trading ideas for November 4:
1) The EUR/USD pair failed to overcome the 1.1612-1.1624 area and began a sharp upward movement. Therefore, buyers are advised to trade to the upside while aiming for the Senkou Span B line (1.1792). Take Profit in this case can be up to 80 points. Take note that sharp price reversals and changes in the mood of market participants are still possible today.
2) Bears have let go of the initiative since they missed the pair above the downward trend line. Therefore, sellers are advised to return to trading downward with targets at 1.1612-1.1624 and the support level at 1.1571, if the price settles below the Kijun-sen line (1.1693). Take Profit in this case can range from 50 to 110 points. You should also be careful with short positions as volatility can be high throughout the day.
Hot forecast and trading signals for GBP/USD
Explanations for illustrations:
Support and Resistance Levels are the levels that serve as targets when buying or selling the pair. You can place Take Profit near these levels.
Kijun-sen and Senkou Span B lines are lines of the Ichimoku indicator transferred to the hourly timeframe from the 4-hour one.
Support and resistance areas are areas from which the price has repeatedly rebounded off.
Yellow lines are trend lines, trend channels and any other technical patterns.
Indicator 1 on the COT charts is the size of the net position of each category of traders.
Indicator 2 on the COT charts is the size of the net position for the "non-commercial" group.
The material has been provided by InstaForex Company - www.instaforex.com