EUR/USD 1H

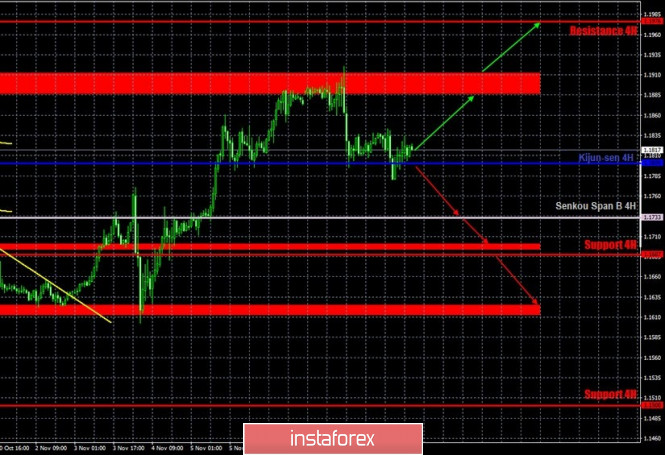
The euro/dollar pair did not make any new attempts to overcome the resistance area of 1.1886-1.1912 and generally moved down on the hourly timeframe on Tuesday, November 10, but was weaker than the day before. Thus, our early forecasts predicting a rebound from the 1.1886-1.1912 area were correct. And since the pair did not settle above this area, traders could continue to trade short during the day. The closest target - the Kijun-sen line - was reached, but it also increased the previous day. In general, the upward trend for the EUR/USD pair still persists in the currency market, despite the fact that there is no trend line now. However, the EUR/USD pair continues to stay above the critical line. And as long as the price is above this line, the outlook for bulls remains. However, we have repeatedly drawn the attention of traders to the fact that it will be very difficult to gain a foothold above the 1.1900 level. And from a fundamental point of view, there is no reason to rise above 1.1900. Thus, we are more inclined towards the option that quotes would fall further. However, sellers need to overcome the Senkou Span B and Kijun-sen lines in order for a full downward trend to appear.
EUR/USD 15M

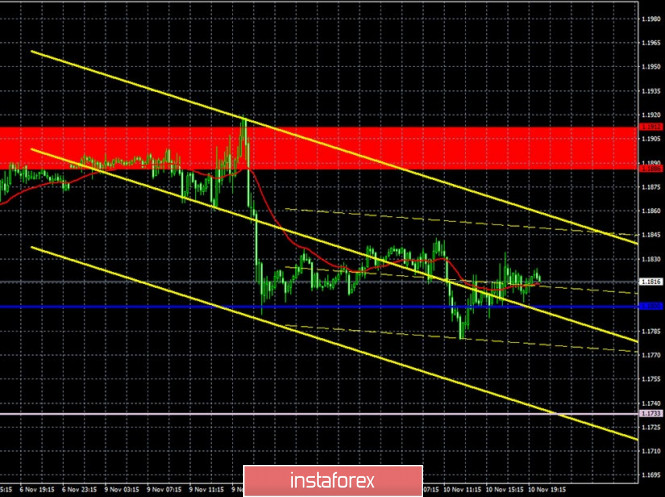
Both linear regression channels turned to the downside on the 15-minute timeframe. However, the key moment now is rebounding from the 1.1886-1.1912 area, which triggered a downward movement, which is still corrective. Further prospects for sellers lie below the Kijun-sen and Senkou Span B.
COT report

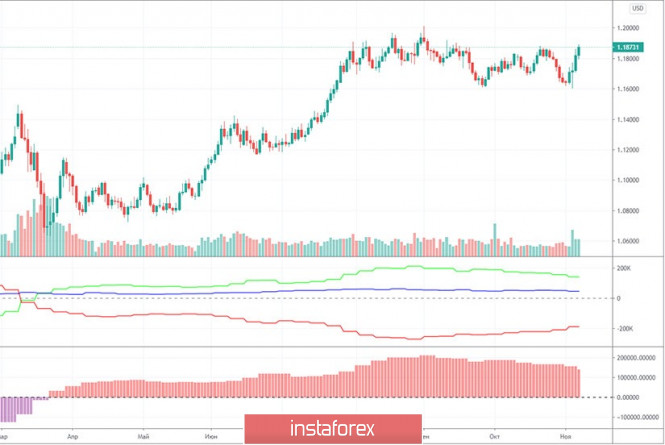
The EUR/USD pair lost 170 points during the last reporting week (October 27-November 2).
A strong upward movement began after this time range. Therefore, the fact that the pair gained 220 points simply does not fall within the timeframe of the latest Commitment of Traders (COT) report. According to it, professional traders closed 9,200 Buy-contracts (longs) and opened 7,800 Sell-contracts (shorts). Thus, the net position for non-commercial traders decreased by 17,000 at once. And any decrease in the net position indicates a strengthening of the bearish mood. Consequently, professional traders continue to look towards selling the euro. Therefore, even despite the subsequent growth, we still believe that the high near the 1.2000 level will still be the peak of the entire upward trend. At least the COT data continues to signal just that. The technical analysis may contradict the COT report, as the latter comes out with a three-day delay. We cannot now know how the big players behaved in the period from November 3 to 6, which is when the dollar was significantly falling due to the elections. Indicators are also signaling good prospects for a new downward trend, as the green and red lines continue to narrow (the first indicator). And they, we recall, reflect the net positions of non-commercial traders and commercial ones.
No macroeconomic releases for America and the European Union on Tuesday. And so traders had nothing to react to during the day. They didn't react. The pair calmly traded throughout the day. The tension in the foreign exchange market continues to subside, and at the same time the dollar starts to rise in price. Therefore, we still expect a technical correction after the 280-point rally. Donald Trump has not yet made any real attempts to cancel the results of the national vote, but continues to threaten and accuse Joe Biden through the media and Twitter.
No important macroeconomic reports for both America and the EU on Wednesday. Thus, the fundamental and macroeconomic background will be rather scarce once again. European Central Bank President Christine Lagarde will deliver a speech, but Lagarde must share important information in order for the markets to react to this event. What can she say? Given the fact that the EU is facing the second wave of COVID-19, the rhetoric of the head of the ECB can only be dovish. She can only take note of the high threats of the second wave of the pandemic for the European economy, as well as a high degree of uncertainty. Thus, either her speech will be uninformative ang traders will ignore it, or it could cause short deals on the euro.
We have two trading ideas for November 11:
1) Buyers need to wait until they have gone beyond the 1.1886-1.1912 area in order to open new buy positions on the pair with the nearest target at the resistance level of 1.1976. Or wait for the price to rebound from the Kijun-sen line (1.1800) and trade up while aiming for the resistance area of 1.1886-1.1912. Take Profit in the first case will be up to 50 points, in the second - up to 60 points.
2) The bears kept the pair below the 1.1886-1.1912 area. However, they need to overcome the Kijun-sen line (1.1800) in order to be able to continue trading downward while aiming for the Senkou Span B line (1.1733) and the 1.1692-1.1699 support area. Take Profit in this case can range from 40 to 80 points.
Hot forecast and trading signals for GBP/USD
Explanations for illustrations:
Support and Resistance Levels are the levels that serve as targets when buying or selling the pair. You can place Take Profit near these levels.
Kijun-sen and Senkou Span B lines are lines of the Ichimoku indicator transferred to the hourly timeframe from the 4-hour one.
Support and resistance areas are areas from which the price has repeatedly rebounded off.
Yellow lines are trend lines, trend channels and any other technical patterns.
Indicator 1 on the COT charts is the size of the net position of each category of traders.
Indicator 2 on the COT charts is the size of the net position for the "non-commercial" group.
The material has been provided by InstaForex Company - www.instaforex.com