GBP/USD 1H

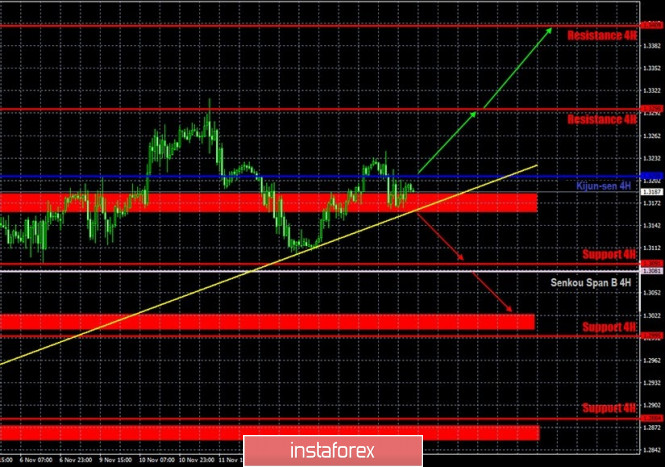
The GBP/USD pair tried to resume the upward movement yesterday and even crossed the critical Kijun-sen line, but could not do so and thus, a new round of the downward correction began very quickly. At the same time, the pound/dollar pair remains above the upward trend line, that is, the upward trend continues. Thus, formally, buyers stay in the game and still have good chances of moving up, at least to the area of the previous local high - the 1.3298 level . At the same time, we have repeatedly said that we are leaning towards the option of starting a new long downward trend. This requires at least breaking the trend line. After that, the initiative in the market will be intercepted by the bears, and you can expect the pound to fall by at least a few hundred points. The fundamental background still signals a very high probability of a fall in the British currency. COT reports are now quite uninformative, but they do not deny this possibility.
GBP/USD 15M

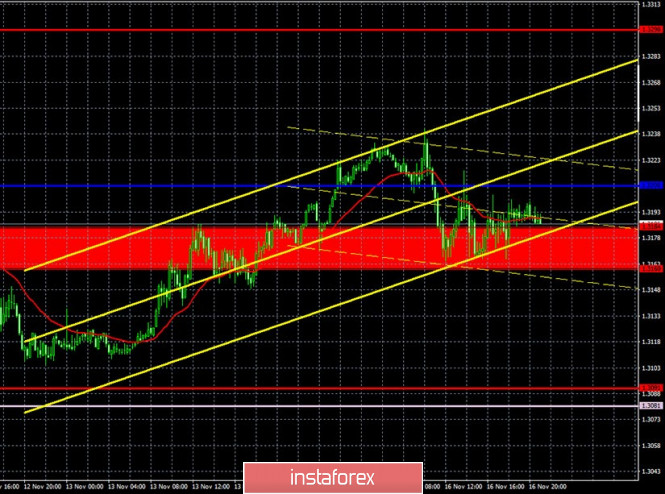
The higher linear regression channels are directed to the upside on the 15-minute timeframe, however, the lower channel turned sideways. Traders were unable to continue the upward movement on Monday, and are increasingly inclined to start forming a new downward trend. The trend line on the hourly chart is now very important for determining the succeeding trend.
COT report

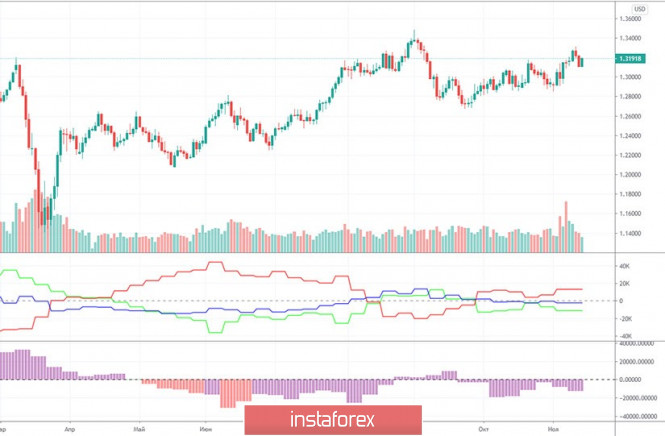
The GBP/USD pair increased by 250 points in the last reporting week (November 3-9). It is not surprising that the pound strengthened, since the US presidential election was held during this period, and the dollar was declining against its main competitors. However, the pound began to grow after this period. In general, the pound has been growing recently. But the Commitment of Traders (COT) reports does not really provide any useful information. Non-commercial traders closed 3,300 Buy-contracts (longs) and opened 1,100 Sell-contracts (shorts). Therefore, they became more bearish, and the net position decreased by 4,400, which is not so small for the pound. Recall that the "non-commercial" group opened a total number of 87,000 contracts. Thus, 4,400 is 5%. As for the general trend among professional traders, the indicators in the chart clearly show that there is no trend at this time. The green line (net position of non-commercial traders) on the first indicator constantly changes its direction. The second indicator also shows the absence of a trend, as professional traders increase the net position, then reduce it. Thus, no long-term conclusions or forecasts can still be made based on the COT report. We recommend paying more attention to technique and foundation.
The fundamental background for the British pound did not change on Monday. Also, as in the case of the euro/dollar pair, there were literally a few and were not really important messages from the UK and America, nothing significant that could cause a market reaction. Not a single important macroeconomic report. Thus, the pound sterling continues to balance on the edge of the abyss. Buyers' hopes remain solely with the prosperous conclusion of negotiations on a trade deal between London and Brussels. If there is no deal (and this may become known as early as this week), then the pound may collapse. We have long come to the conclusion that the pound is overbought. And since there is still no positive news from Great Britain, the pound, in principle, has no reason to continue (!!!) growth.
Bank of England Governor Andrew Bailey is set to deliver a speech on Tuesday. However, as with European Central Bank President Christine Lagarde and Federal Reserve Chairman Jerome Powell, Bailey's recent speeches were too uninformative and uninteresting. Therefore, Bailey may not mention anything important today. However, traders have long been waiting for the UK central bank to resort to negative rates. And it seems that even the BoE representatives do not deny that sooner or later they will have to resort to this instrument of monetary policy. Thus, any information about the timing of the introduction of negative rates can affect the mood of traders. And the pound. Negatively.
We have two trading ideas for November 17:
1) Buyers for the pound/dollar pair have a hard time keeping the initiative in their hands. Thus, we recommend buying the pair while aiming for resistance levels 1.3298 and 1.3409, if the bulls manage to keep the pair above the trend line and overcome the critical Kijun-sen line (1.3208). Take Profit in this case will be from 60 to 170 points.
2) Sellers could not pull down the pair below the trend line. If the price settles below the trend line, the trend will change to a downward one and you can sell the pound/dollar pair while aiming for the Senkou Span B line (1.3081) and the support area of 1.3004-1.3024. Take Profit in this case can range from 60 to 100 points.
Hot forecast and trading signals for EUR/USD
Explanations for illustrations:
Support and Resistance Levels are the levels that serve as targets when buying or selling the pair. You can place Take Profit near these levels.
Kijun-sen and Senkou Span B lines are lines of the Ichimoku indicator transferred to the hourly timeframe from the 4-hour one.
Support and resistance areas are areas from which the price has repeatedly rebounded off.
Yellow lines are trend lines, trend channels and any other technical patterns.
Indicator 1 on the COT charts is the size of the net position of each category of traders.
Indicator 2 on the COT charts is the size of the net position for the "non-commercial" group.
The material has been provided by InstaForex Company - www.instaforex.com