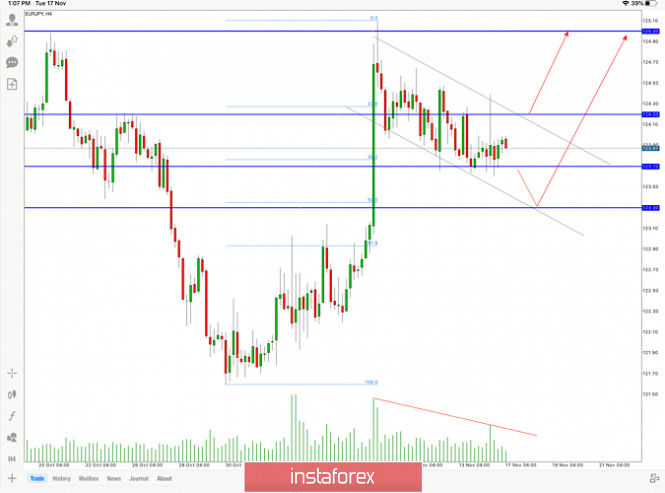
The EURJPY pair has been making the up and down consolidation move for the past week.
The pair rallied on 9 November. A push higher was extended above 125.00 that is a key psychological barrier zone. But the price failed to close above it. The subsequent fall from resistance of 125.00 erased those gains (and a little more), completing the trading range today.
November 9th's impulsive bullish move with a spike high ended up in a corrective market phase since 10 November. The pair may have also been supported by a descending bearish channel which is coming into play from a technical viewpoint.

Overall a formation of a bull flag pattern is seen. Explosive moves are often associated with the bull flag .A brief pause in the trend for the past 6 trading days is following a strong price move higher of 9th November. The bull flag pattern looks like a downward sloping channel/rectangle plotted by two parallel trendlines against the preceding trend.
During this period of consolidation, a trade volume is reducing through its formation. A push higher on the breakout above 124.20 may lead EUR/JPY to test the 125.00 critical barrier once again . If the price can stay below 123.30 support level, the sellers will have a shot at going for 123.30 which coincides with a 50% retracement .
Key things to look out for when trading the bull flag pattern are:
- Preceding uptrend (flag pole)
- Identify downward sloping consolidation (bull flag)
- If the retracement becomes deeper than 50%, it may not be a flag pattern. Ideally, the retracement ends at less than 38% of the original trend
- Enter at bottom of the flag or on the breakout above the high of the upper channel boundary
- Look for price to break higher with a length potentially equal to the size of the flag pole
