Technical Market Outlook:
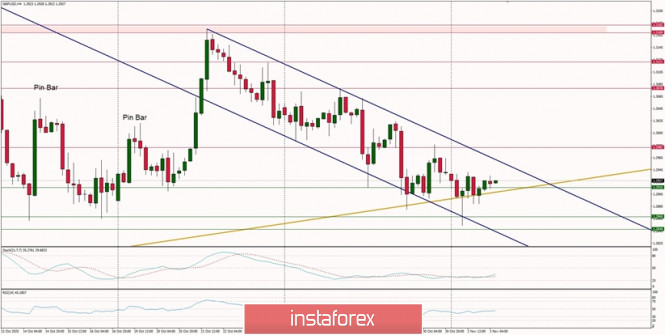
The GBP/USD pair keeps going lower in a descending channel and another lower low was made at the level of 1.2854, which is at the short-term trend line support. The candle on the H4 time frame chart that made the low looks like a Pin Bar, so the bulls are defending the trend line support. Any sustained violation of this trend line will indicate more bearish pressure that can push the prices to the level of 1.2868, 1.2848 or even 1.2816. The weak and negative momentum supports the short-term bearish outlook despite the oversold market conditions. Only a sustained breakout above the level of 1.2982 would change the intraday outlook to bullish.
Weekly Pivot Points:
WR3 - 1.3236
WR2 - 1.3153
WR1 - 1.3037
Weekly Pivot - 1.2956
WS1 - 1.2835
WS2 - 1.2757
WS3 - 1.2653
Trading Recommendations:
The GBP/USD pair is in the down trend on the monthly time frame, but the recent bounce from the low at 1.1411 made in the middle of March 2020 looks very strong and might be a reversal swing. In order to confirm the trend change, the bulls have to break through the technical resistance seen at the level of 1.3518. All the local corrections should be used to enter a buy orders as long as the level of 1.2674 is not broken.

