GBP/USD - 24H.

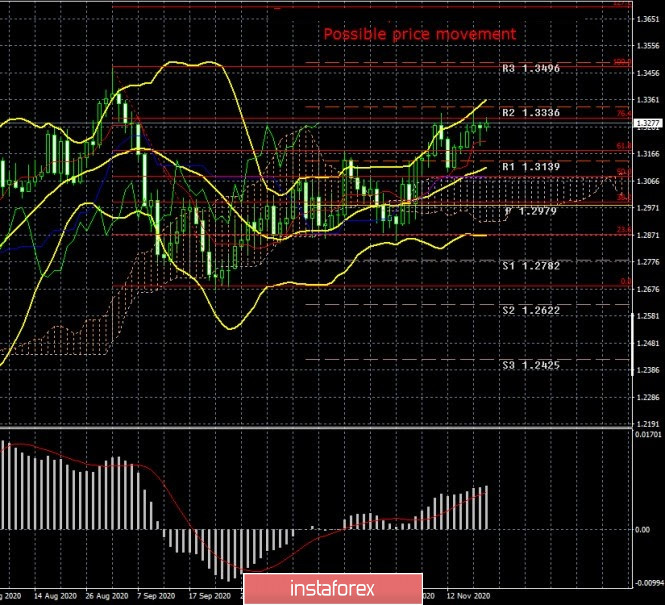
The GBP/USD currency pair has grown by about 80 points over the past week and thus returned to the 76.4% Fibonacci level. Earlier, we talked about the 61.8% Fibonacci level, from which the pair's quotes bounced at one time, now we are talking about the 76.4% level, from which there was also one rebound. However, despite two rebounds from two important Fibonacci levels, the pound/dollar pair did not start a downward movement, which would be logical from a fundamental point of view. However, we will talk about the foundation below. So far, we have another test of the level of 1.3300, above which the pair's quotes again failed to leave. Thus, the upward trend on the 24-hour timeframe remains, as it is indicated by both the Ichimoku indicator and the Bollinger bands, but we recommend that you trade based on the 76.4% Fibonacci level in the long term. Overcoming this level will show that market participants are ready to continue buying the British currency, although, from our point of view, there is still no reason for this. However, as we said earlier, any fundamental theory must be supported by technical analysis, which is currently not the case.
The COT report.

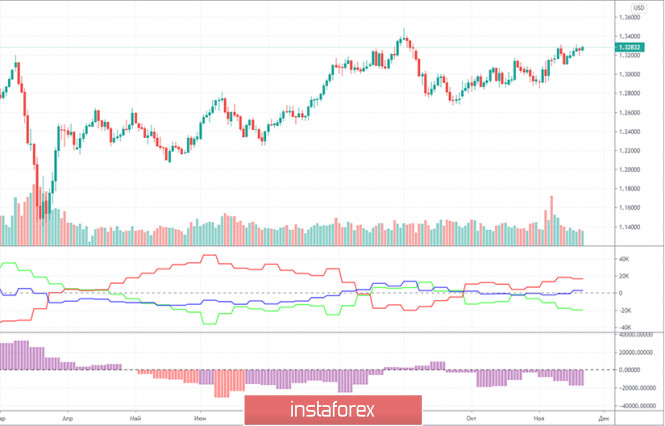
During the last reporting week (November 10-16), the GBP/USD pair increased by 25 points, although the volatility was quite high during this period. However, the COT report has not given us any important information that could help in forecasting and trading for a week in a row. Recall that the red and green lines must move away from each other or sharply change the direction of their movement so that we can conclude that one trend ends and another begins. In recent months, both lines regularly change their direction, which indicates that there are no signals based on COT reports. What can we say about the most important group of "Non-commercial" traders? This group opened 533 contracts to buy the pound and 616 contracts to sell during the reporting week. Thus, it does not even make much sense to calculate the change in the net position or the amount by which the mood of professional traders has changed. A little more than 1,000 contracts per week are very small. So, there are no changes. What do we end up with? There are no changes, and the overall picture of things does not make it possible to predict any specific development of the situation. Thus, it is better now to pay more attention to the "technique" and "foundation".
The fundamental background for the GBP/USD pair last week was very contradictory. In this article, we will not consider the fundamental background in America, only from the UK. And for Foggy Albion, we can say the following. First, the "coronavirus" in Britain is also raging and is also not perceived by traders as a factor that deserves to be worked out. Second, the most important topic for the British pound is Brexit and trade negotiations with the European Union. And it is this topic that has not given any food for thought to traders over the past week. Let's start with the fact that negotiations on a trade deal should have been completed already 5 times. They were supposed to end by October 15, then by November 15, and then by the EU summit on November 18. As a result, on Thursday, one of the participants in the negotiation process fell ill with "coronavirus" and the negotiations were interrupted altogether. And since then, no official information has been received. But throughout the week, all kinds of media, publications, newspapers, and magazines repeatedly stated their expectations regarding the completion of negotiations. And all this information was only confusing since it is not official. Some wrote that "the deal is about to be concluded", the second - about a complete failure in the negotiations. And the pound seems to have the most confidence that a deal will be done. The most interesting thing is that if it is signed, the pound may not rise in price on this news. Since it has been growing for several weeks solely on expectations of the conclusion of this agreement. But if there is no deal, the pound may well fall by 300-500 points in the medium term, because this will mean new problems for the British economy, of which there are already plenty
Trading plan for the week of November 23-27:
1) Customers retain some chances for the formation of the upward trend. Most of all, the fundamental background continues to confuse, which does not support the British pound. Nevertheless, long positions remain relevant with the targets of the resistance levels of 1.3336 and 1.3496, but we believe we need to wait for a confident overcoming of the level of 76.4%-1.3300 to resume trading on the increase.
2) Sellers now remain quite weak. We can even conclude that neither bulls nor bears are now eager to trade the pound sterling. The COT report shows minimal changes and minimal activity of major players from time to time. Sellers need to return the pair below the Ichimoku cloud to expect a downward trend to form again in the long term. We are still inclined to believe that the fall in the pound will resume and will be quite strong. But this hypothesis, like any other, needs technical confirmation.
Explanation of the illustrations:
Price levels of support and resistance (resistance/support) – target levels when opening purchases or sales. You can place Take Profit levels near them.
Ichimoku indicators, Bollinger bands, MACD.
Support and resistance areas – areas that the price has repeatedly bounced from before.
Indicator 1 on the COT charts – shows the net position size of each category of traders.
Indicator 2 on the COT charts – the net position size for the "Non-commercial" group.
The material has been provided by InstaForex Company - www.instaforex.com