GBP/USD – 24H.

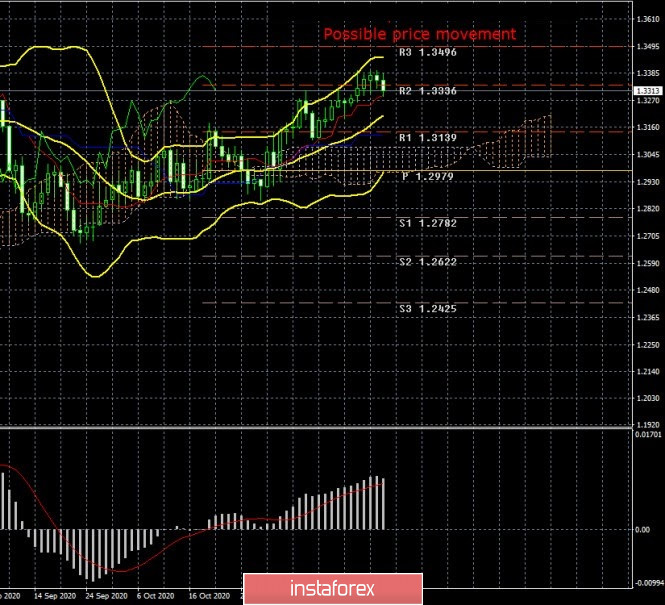
The GBP/USD currency pair has increased by about 20 points over the past week, which is a very weak volatility value for this pair. However, this is the final value of the week. Maybe the situation was different for each individual day? No. Volatility remained fairly low all week. At the same time, an upward trend continued in the long term, which has long caused surprise and doubts about its validity. However, as we have repeatedly warned, this is a currency market, and no one can predict its behavior by 100%. The fundamental background may be completely against the pound, but if market participants buy it (for any reason), it will grow. Thus, we always warn that any fundamental theory and hypothesis must be confirmed by "technology". As long as this is not the case, no matter what the "foundation", it is recommended to trade according to the trend, that is, to increase. The previous local high has not been updated yet (1.3481), so there are still theoretical chances of a new downward trend starting. Also, we would not particularly count on the "double top" pattern.
COT report.

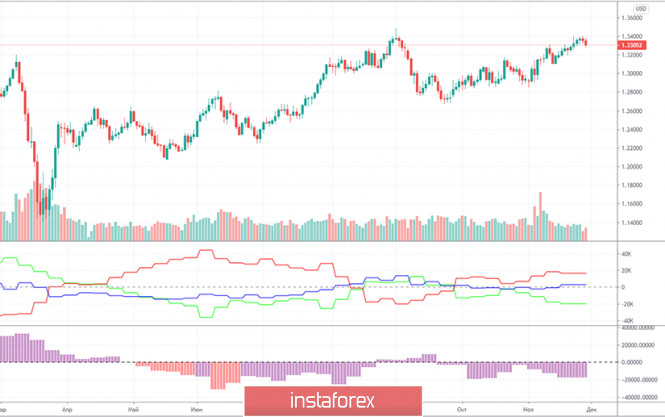
During the last reporting week (November 17-23), the GBP/USD pair increased by 135 points, thus, in the COT report for this period, we could expect an increase in the "bullish" mood of professional traders. Analyzing the report on the euro currency, we said that the changes are minimal. In the case of the pound, they are not minimal, they simply do not exist. During the reporting week, the most important group of non-commercial traders opened 533 buy and 616 sell contracts. In other words, the net position for this group of traders decreased by less than 100 contracts. The total number of open contracts is about 90,000. Therefore, the conclusion is obvious: during the reporting week, professional traders had a rest. In principle, both indicators show the same thing. The first one has changed direction very often in recent months (the green and red lines are constantly unfolding), which indicates that there is no definite trend and a clear mood among professional players. The second one shows the same lack of trend in the mood of non-commercial traders. Thus, all the data in the COT report now says only one thing: no forecasts can be made, since there are very few changes.
The fundamental background for the GBP/USD pair remained absolutely discouraging last week. It is only necessary to say that there was no news about the results of the negotiations between London and Brussels. That is, in principle, now we can conclude that this topic is not the main one for the pound/dollar pair. All the same, the British currency has shown growth in recent weeks, which is completely inconsistent with the risks that a "divorce" with the European Union without a trade agreement carries for the British economy. Andrew Bailey spoke about this, and many experts in the field of macroeconomics and many analysts speak about it. However, the pound still continues to grow. Hence the conclusion: traders either ignore the fundamental background or blindly believe that a deal between the EU and Britain will be concluded in any case. We do not undertake to judge whether these hopes are justified. From our point of view, the probability of reaching an agreement on this issue is still very low, since "serious differences remain" in the most important issues: fishing, fair competition and dispute resolution. Thus, the deal can be agreed upon by 95%, but without resolving these issues, it will not be signed. And most importantly, the parties have very little time left if they want to have time to ratify the agreement before the New Year, that is, before the end of the "transition period". Well, of course, not without mutual reproaches on both sides. According to London, the European Union does not want to give in and encroaches on the independence of Great Britain, trying to tie it as much as possible to its legislation. According to Brussels, Britain does not want to concede, but wants to retain all the privileges of EU membership, while not being in the EU. Thus, the parties still cannot agree.
Trading plan for the week of November 30-December 4:
1) The upward movement has continued in recent weeks, although the resumption of the upward trend is still questionable. Until the maximum of September 1 is overcome, the current upward movement is interpreted as a correction. Most of all, the fundamental background continues to confuse, which absolutely does not support the British pound. Thus, for the time being, upward trends remain more preferable for working out on lower time frames.
2) Sellers now remain quite weak. The COT report shows minimal changes and minimal activity of major players from time to time. Sellers need to return the pair below the Ichimoku cloud in order to expect a downward trend to form again in the long term. We are still inclined to believe that the fall in the pound will resume and will be quite strong. But this hypothesis, like any other, needs technical confirmation.
Explanation of the illustrations:
Price levels of support and resistance (resistance/support) – target levels when opening purchases or sales. You can place Take Profit levels near them.
Ichimoku indicators, Bollinger bands, MACD.
Support and resistance areas – areas that the price has repeatedly bounced from before.
Indicator 1 on the COT charts – shows the net position size of each category of traders.
Indicator 2 on the COT charts – the net position size for the "Non-commercial" group.
The material has been provided by InstaForex Company - www.instaforex.com