EUR/USD

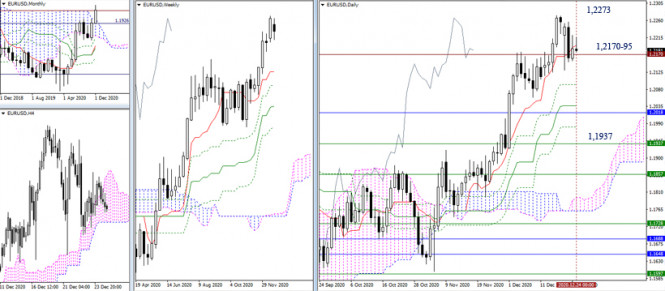
The shape of the weekly candle can be attributed to the Harami variants. With proper confirmation, a new and effective correctional decline is likely to follow in the near future. The main reference point for the bearish weekly Harami will be the weekly short-term trend, the level is currently located at 1.1937. The development path of the weekly correction goes through eliminating the daily golden cross (1.2092 - 1.2037 - 1.1981) and the border of the monthly cloud (December 1.2018), which will leave the level (1.1891) in January. If the current global financial trends still suggest a bullish advantage and that there is a possibility to sustain the upward trend on the EUR/USD chart, then the situation will take more time and the pair will settle in an appealing area at the 1.2195-70 level (daily short-term trend + record level). The nearest bullish reference is the high at 1.2273. Getting the pair to settle above this level will make it possible for us to consider new perspectives.

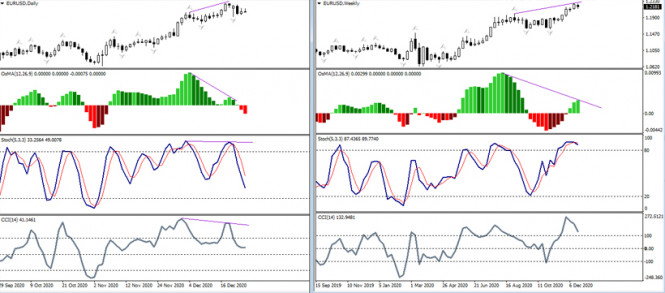
Daily bearish divergences formed peaks and received confirmation in the form of a corrective discharge. Over the weeks, the OSMA indicator still creates the prerequisites for a creating a divergence, and to do so a new activity and the effectiveness of the players for a decline are necessary to create the divergence.
GBP/USD

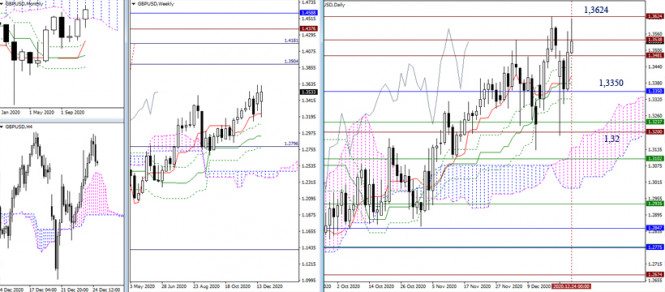
The bulls were unable to fully recover their positions, although they closed the downward gap on Monday, which provoked a sharp large-scale decline. The pair remained in an appealing zone of record levels at 1.3481-1.3538. To restore the upward trend and the emergence of new prospects, it is necessary to update the high (1.3624) and ensure that the pair settles above it. Subsequent upward targets can still be noted at 1.3904-1.4181 - 1.4376-1.4588 (weekly target for the breakout of the Ichimoku cloud + record level + upper border of the monthly cloud). The lower border of the monthly cloud (1.3350), which will retain its position in January, is still the key support for this area.

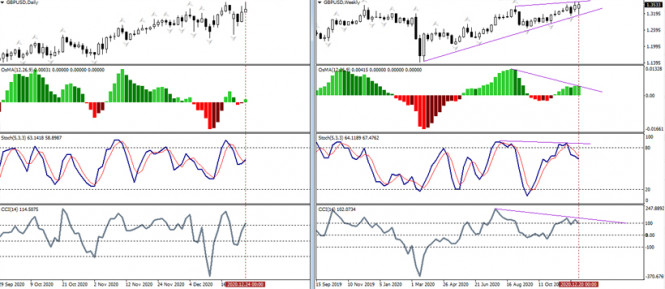
The daily timeframe has not created divergences, but the weekly time interval continues to preserve divergences, and the prerequisites to create them. Breaking the support of the trend line will probably help to defuse the situation of bearish divergences.
Ichimoku Kinko Hyo (9.26.52), Pivot Points (Classic), Moving Average (120)
The material has been provided by InstaForex Company - www.instaforex.com