To open long positions on EUR/USD, you need:
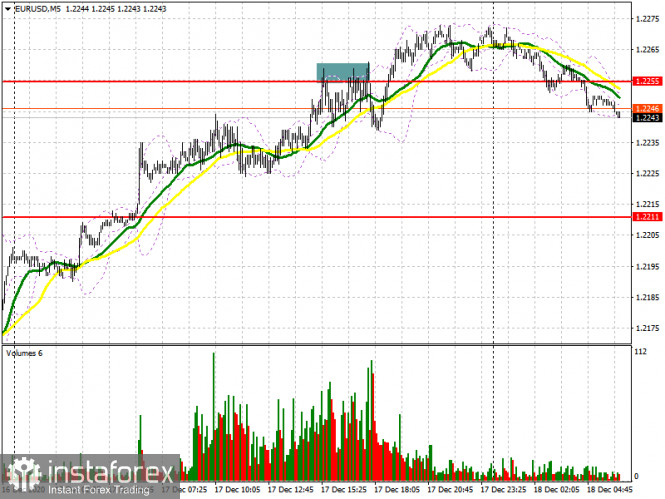
Data on the US labor market, which turned out to be worse than economists' expectations, caused the euro to rise in the afternoon and there was also an attempt to surpass the 1.2255 level, which has now turned into another resistance. However, take note that the signal to sell the euro, which appeared at the beginning of the US session, was quite good, the implementation just simply failed. Let's take a look at the 5-minute chart. I have highlighted the 1.2255 area, which I drew attention to in yesterday's review. You can see how the bulls made several unsuccessful attempts to consolidate higher, forming a false breakout there and a signal to sell the euro. However, the downward movement was around 17 points, and afterwards buyers hoped to break this range and the bull market continued.

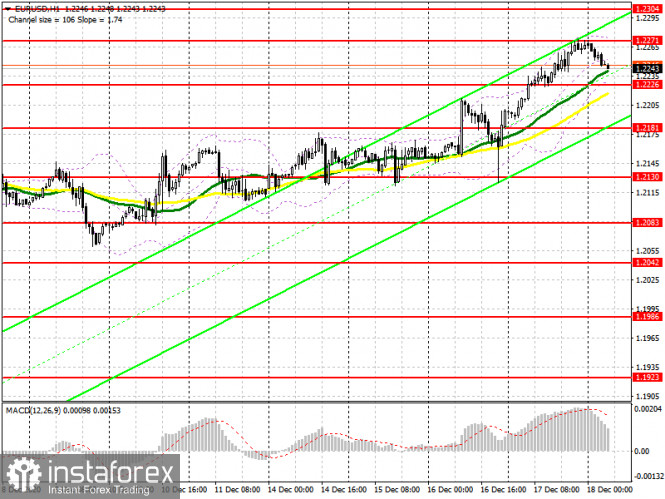
Today, buyers will be puzzled by protecting the support level of 1.2226 in the first half of the day, where the pair is now declining. Moving averages also pass there, playing on the side of buyers. The pair began to fall during the Asian session, and forming a false breakout in the 1.2226 area will help stop the bearish momentum, which will lead to producing a convenient entry point to long positions in order to sustain the upward trend and return to a new high of 1.2271. A breakout and being able to settle above this range, along with good reports on the indicator of business environment, the indicator for assessing the current situation and the indicator of economic expectations from IFO Germany, will open new highs for euro buyers in the areas of 1.2304 and 1.2339, where I recommend taking profit. If buyers are not active in the 1.2226 area, a breakdown of this level may take place. In this case, it is better not to rush to buy, but to wait until a larger low at 1.2181 has been updated, from where you can open long positions immediately on the rebound, counting on an upward correction of 20-25 points within the day.
To open short positions on EUR/USD, you need:
Euro sellers hope to regain control over the 1.2226 level. Getting the pair to settle below this range and testing it from the other side will increase the pressure on the pair, which produces a good entry point for short positions. In this case, the main target will be the 1.2181 area, where I recommend taking profit. It is highly doubtful to expect the euro to return to the support area of 1.2130 at the end of this week. If the bulls manage to protect support at 1.2226, and the data for Germany turns out to be better than the economists' forecasts, we can expect a bull market and EUR/USD may return to an annual high of 1.2271. I recommend opening short positions from there only after forming a false breakout. It is best to count on selling on a rebound only after levels 1.2304 and 1.2339 have been tested, counting on a downward correction of 15-20 points within the day.

The Commitment of Traders (COT) report for December 8 recorded an increase in long positions and a reduction in short positions. Buyers of risky assets believe in sustaining the bull market and the euro's growth after surpassing the psychological mark in the area of the 20th figure. Thus, long non-commercial positions rose from 207,302 to 222,521, while short non-commercial positions fell from 67,407 to 66,092. The total non-commercial net position rose from 139,894 to 156,429 a week earlier. It is worth paying attention to the growth of the delta, observed for the third consecutive week, which completely negates the bearish trend observed at the beginning of this fall. We can only speak of a larger recovery after European leaders negotiate a new trade agreement with Britain.
Indicator signals:
Moving averages
Trading is carried out slightly above 30 and 50 moving averages, which indicates an attempt by euro buyers to sustain the upward trend in the euro.
Note: The period and prices of moving averages are considered by the author on the H1 hourly chart and differs from the general definition of the classic daily moving averages on the daily D1 chart.
Bollinger Bands
A breakout of the upper border of the indicator in the 1.2271 area will lead to a new upward movement for the euro. A breakout of the lower border of the indicator in the 1.2226 area will increase pressure on the pair and cause the euro to fall.
Description of indicators
- Moving average (moving average, determines the current trend by smoothing out volatility and noise). Period 50. It is marked in yellow on the chart.
- Moving average (moving average, determines the current trend by smoothing out volatility and noise). Period 30. It is marked in green on the chart.
- MACD indicator (Moving Average Convergence/Divergence — convergence/divergence of moving averages) Quick EMA period 12. Slow EMA period to 26. SMA period 9
- Bollinger Bands (Bollinger Bands). Period 20
- Non-commercial speculative traders, such as individual traders, hedge funds, and large institutions that use the futures market for speculative purposes and meet certain requirements.
- Long non-commercial positions represent the total long open position of non-commercial traders.
- Short non-commercial positions represent the total short open position of non-commercial traders.
- Total non-commercial net position is the difference between short and long positions of non-commercial traders.
